Economic Viability of Wind Energy

Tim Phillips, in The Wall Street Journal, quoted Christopher Flavin, of the Worldwatch Institute, as saying in 1984,

Tax credits have been essential to the economic viability of wind farms so far, but will not be needed within a few years.

It’s been a few years. It’s been 30 years’ worth of “few.”

In all, wind energy “generators” get $56.29 per MW-Hr in Federal subsidies. To put that in perspective, natural gas gets $0.64, and nuclear power $3.14.

These guys are free-loading off you and me, and it’s time to put a stop to it. They need to stand or fall in the free market: if their technology is ready for prime time, they’ll have no trouble. If their technology isn’t—after 30 years—they’ve had enough of our prop-up money.

Cut off the subsidies—or more accurately, do not renew them (they expired in 2013) with finality. While the new Congress is about it, it should cut off those natural gas subsidies (those for oil, too, even though they’re similarly just walking around money) and the nuclear energy subsidies, also.

The free market is a much better watchdog for energy production than the Federal government ever can hope to be, no matter how honest or diligent those bureaucrats and regulators might be.

“Climate” Again

Texas and California are in the middle of droughts. This is, of course, due to man-caused climate change. Or is it? Watts Up With That has a couple of graphs that bear on the matter.

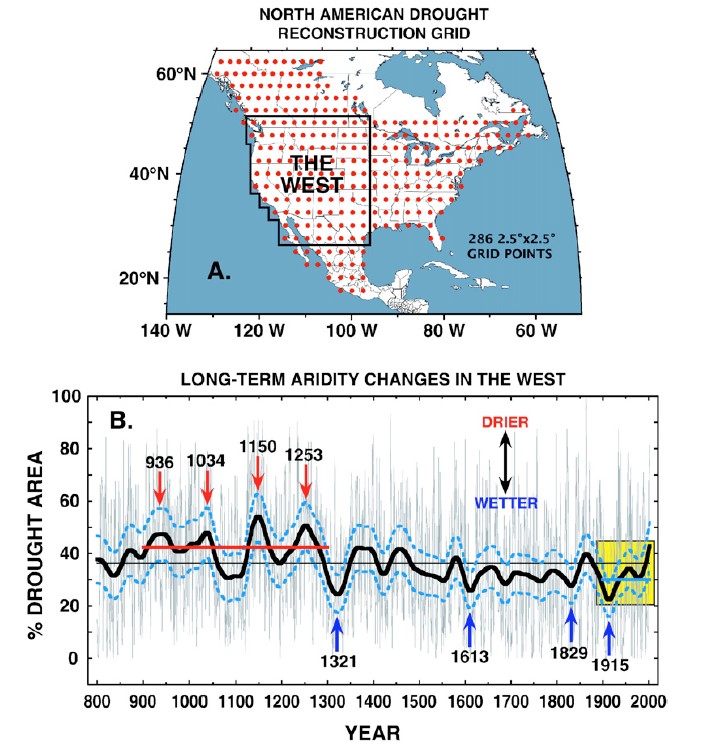
This one gives one idea of the history of droughts and wet periods over the last, oh, say, 1,200 years:NorthAmericaDroughtGrid

The dots in the upper part of the figure give the locations at which measurements were taken. The lower part gives the time history of wet vs dry for the time frame indicated; the dotted lines flanking the solid black line give the error range for the measurements. The shaded yellow area to the right indicates the (limited) time frame of interest to our climate panic mongers. The average dryness for an earlier period (notice that it’s outside the time of interest to our mongers) is shown by the solid red line, and the average wetness is shown by the blue line that’s partially obscured by the yellow shading.

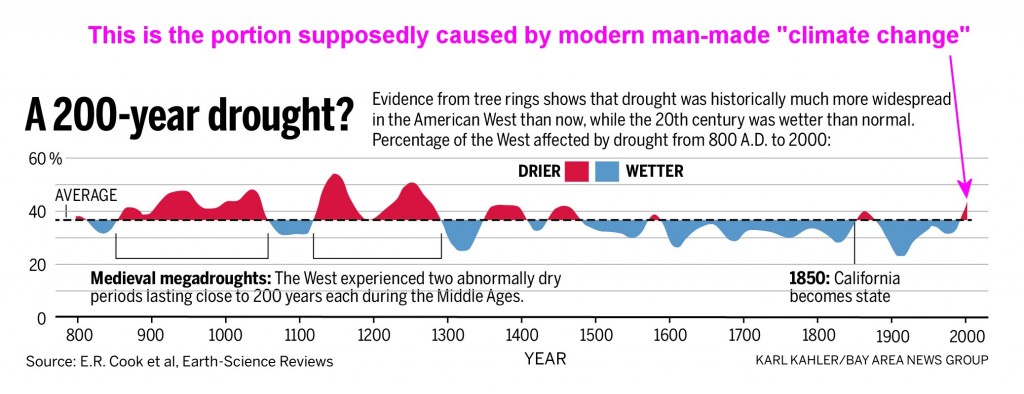
This graph gives a clearer indication of wet and dry periods, including that long time frame so studiously ignored by our mongers. The graph points up California’s strait because Watt’s article was centered on all the nonsense California’s Democrats are spouting about their drought. It pretty much speaks for itself.200YrCaliforniaDrought

The graph’s small text may be hard to read; it says

Evidence from tree rings shows that drought was historically much more widespread in the American West than now, while the 20th century was wetter than normal. Percentage of the West affected by drought from 800 AD to 2000.

Hmm….

Ukraine and Energy

America’s booming natural gas production could help Ukraine keep the heat and lights on amid Russia’s latest threat to cut off supplies, if the US cuts through troublesome red tape, lawmakers said. … The U.S. has port facilities that turn natural gas into liquid for export and more are under construction, but shipping to any country not bound by a free trade agreement with the US requires a federal permit. Since 2011, DOE has approved six [count ’em] applications for permits to export natural gas to non-free trade agreement nations, but Ukraine is not one of them. … [The] “Domestic Freedom and Global Prosperity Act”…would grant immediate approval of the 24 pending applications currently filed with the Department of Energy…. “This would send the clear signal that we are serious about enlarging the scope of natural gas exports, and immediately undercut Russia’s dominance,” [Congressman Fred (R, MI)] Upton said. “Russia has chosen to wield its energy resources as a geopolitical weapon to inflict harm on others. As the world’s emerging energy superpower, America has a newfound responsibility to help our allies.”

There are a lot of logistics problems along this path to work out, but that puts a premium on getting started; these problems cannot be allowed to serve as excuses for not bothering. Again.

On top of that, we also need to stop sending signals and start sending stuff—like oil and gas, like weapons, like intel, like…—to Ukraine, as well as sending oil and gas to Germany and the rest of the EU.

Demon Oil

…and its evil carbon footprint. Here, courtesy of Mark Perry, writing for AEIdeas, are 10 examples of the destruction demon oil has wrought in North Dakota.

1. … [I]t took almost 58 years for the Bakken oil fields to produce the first 500 million barrels of oil from 1954 to July 2012; and then, thanks to the shale oil revolution, the Bakken oil fields produced the second 500 million barrels in less than two years—from July 2012 to March 2014!

2. In 2004, North Dakota ranked No. 9 for oil production by state, but then thanks to the shale oil boom in the Bakken, the state quickly rose to the No. 6 spot by 2008, the No. 4 spot in 2009, and then surpassed both California and Alaska in 2012 to become America’s second-largest oil producing state, behind only Texas.

3. … At one million barrels of oil every day, the North Dakota Bakken now produces more oil than entire countries like Colombia, Oman, and the UK.

4. In each of the last 69 months since January 2009, North Dakota has recorded the lowest state jobless rate in the country and led the country as the state with the highest rate of private sector job growth. …North Dakota’s jobless rate has been below the US jobless rate by an average of more than 5 percentage points over the last five years. Over the last 12 months through March, private payrolls in North Dakota have grown by…more than twice the national average of 2.25% in private sector job growth.

5. Over the last three years, the jobless rate in Williams County, North Dakota, in the heart of the Bakken oil fields, has averaged less than 1%, and has been as low as 0.7% in six different months.

6. According to the Conference Board, there were more than twice as many advertised online job openings in North Dakota in March (21,900) than there were unemployed workers seeking employment (10,610)…. At the national level…there are more than twice as many unemployed workers (10,486,000) as online advertised job vacancies (4,894,000).

7. The Census Bureau reported recently that three of the five fastest growing micro areas (cities with populations of 10,000 to 50,000) in the country between July 2012 and July 2013 were in North Dakota [including two of the top two].

8. The BEA reported recently that North Dakota led the country last year with the highest growth in state personal income at 7.6%, almost three times the national average of 2.6% growth….

9. North Dakota has boasted a state budget surplus in every year since 2008, when shale oil brought an unprecedented level of new jobs, wealth and prosperity to the state.

10. This might be the most impressive economic fact about North Dakota…: in 2006, North Dakota was America’s 11th poorest state by personal income per person. In just seven years, thanks the shale revolution, the Peace Garden State rose to become the nation’s 2nd most prosperous state in 2013, ranking behind only Connecticut last year for personal income per capita….

Read ’em and weep.

Energy Security

There’s energy security and there’s energy.

The US could suffer a coast-to-coast blackout if saboteurs knocked out just nine of the country’s 55,000 electric-transmission substations on a scorching summer day[.]

This FERC study also pointed out that it’s not a fixed nine substations; there are various combinations of the nine that can achieve this.  Furthermore, if a transformer manufacturing plant is added to the mix of targets, a memo written by FERC staff for then-FERC Director Jon Wellinghoff warned

Destroy nine interconnection substations and a transformer manufacturer and the entire United States grid would be down for at least 18 months, probably longer[.]

This vulnerability has been known to FERC and others in the Federal government for quite some time, but FERC’s response has been limited to two actions: one has been to order the various utilities to “Handle it, handle it.”

The other has been to cover its own behind by calling out the press that exposed FERC’s failure:

Today’s publication by The Wall Street Journal of sensitive information about the grid undermines the careful work done by professionals who dedicate their careers to providing the American people with a reliable and secure grid.    Nonetheless, the publication of other sensitive information is highly irresponsible.  While there may be value in a general discussion of the steps we take to keep the grid safe, the publication of sensitive material about the grid crosses the line from transparency to irresponsibility, and gives those who would do us harm a roadmap to achieve malicious designs.  The American people deserve better.

You read that right.  FERC is busily denigrating those who’ve publicized this vulnerability failure.  What they should be doing is correcting this…weakness.  And explaining how they allowed this weakness to exist 13 years after terrorists attacked so devastatingly.  Or resigning their positions in the disgrace they’ve earned.

The American people do, indeed, deserve better.