Carbon Dioxide and Bias at the EPA

Cass Sunstein thinks there’s bias in the Trump EPA in the way the agency handles CO2.  He’s right, but not in the way he thinks.

The only way to solve the climate-change problem, and to prevent massive harm in the US, is for all the world’s big emitters [of CO2] to agree to take account of the global damage.

There’s the heart of the political concern and a demonstration of Sunstein’s bias.

Carbon’s role in the environment is its contribution to acid rain through its role as a constituent of CO2. That problem has been solved, years ago.

CO2’s role in climate is demonstrated by ice cores that show atmospheric CO2 rises after planetary warming has begun and by longer records that show, over geologic time, a lack of correlation between atmospheric CO2 and planetary temperature. That problem does not exist.

Finally, there is some overlap between environment and climate, but they are not interchangeable terms, even though Sunstein uses them so.

Exxon’s Carbon Tax

Exxon Mobil Corp is throwing $1 million at the move to produce a national carbon tax.

Exxon’s move is an attempt to manage what it sees as the risk of a similar movement in the US, in ways that it hopes will simplify requirements on its industry….
Exxon sees a carbon tax as an alternative to patchwork regulations, putting one cost on all carbon emitters nationwide, eliminating regulatory uncertainty….

On the contrary, Exxon is looking for short-term competitive political advantage at the expense of long-term economic—real—advantage.  That’s unfortunate.

It’s also unfortunate because, leaving aside the question of whether a carbon tax even would work as claimed, the scheme is based on the false premise that increasing atmospheric CO2 somehow is bad.  Atmospheric CO2 is, in fact, critical—as in can’t live without it—plant food.  In addition to that small fact, ice core samples from both ends of the earth—Greenland and Antarctica—reaching back 400,000 years indicate that rising atmospheric CO2, far from being a harbinger of bad warming to come, lags planetary warming by several hundred years.  The rise confirms that a cold planet is warming out of its Ice Age, and life is recovering and exhaling increasing amounts of CO2 into the atmosphere.

Climate Change and Wildfires

Much is being made about how anthropogenic global warming is causing all those wildfires in California.  Cliff Mass had a different view [emphasis in the original].

there is a lot misinformation going around in the media, some environmental advocacy groups, and some politicians.   The story can’t be a simply that warming is increasing the numbers of wildfires in California because the number of fires is declining.  And area burned has not been increasing either.

And [emphasis added]

[N]ow we get into the real interesting questions that many are not considering.   What is driving the ups and downs in wildfires?  There are so many factors that must be considered, such as:

  1. The fact that extensive fires are a natural historical part of the ecology of the region
  2. The impacts of a huge increase of human population, creating increasing vulnerability while humans are starting most of the fires.
  3. Climate change that causes warming and changing the precipitation patterns (both wetter and drier) that influence fire frequency and size.
  4. Mismanagement of our forests and wild areas, allowing tree and debris-choked landscapes
  5. Invasive and often highly flammable non-native species brought in by man (e.g., cheatgrass and Eucalyptus)

Clearly, climate change is only one possible factor in controlling fire frequency and may not be the most important.

Indeed, our climate has been warming for the 4.5+ billion years of Earth’s existence.  Our sun has been heating up for the 4.5++ billion years of its existence.

But the, actual facts have never interested global not-warming deniers.


h/t Watts Up With That?

Climate and Atmospheric CO2

In a piece on Watts Up With That, Eric Worrall explored the relationship between atmospheric CO2 and temperature.  (Yes, yes, I know the science is settled, but the fact is the only thing settled is the pseudo-science nesting in the fetid imaginations of climate “science” funding industry personages.  The rest of us keep asking rude questions.)

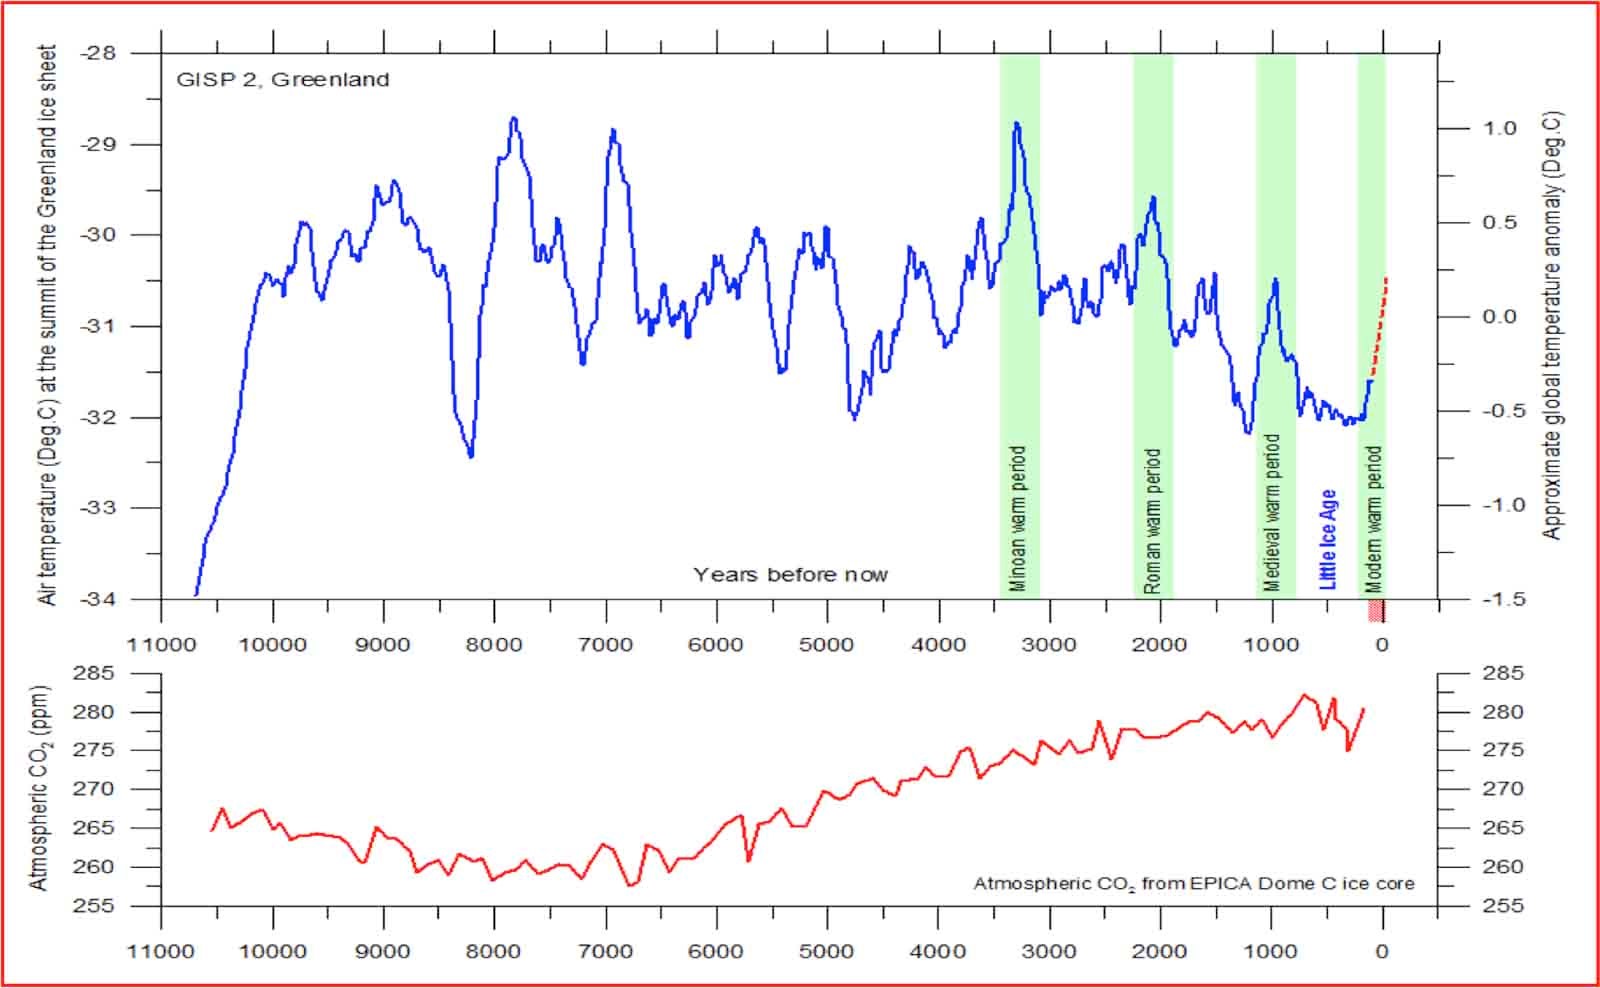
Using data consisting of meteorological records back to the 1850s and other data collected from sources like “isotope ratios in gas samples extracted from ice cores and seabed cores,” temperature records of Earth dating back hundreds of thousands of years (ice core data from Greenland and Antarctica reach back 400,000 years, for example), Worall was able to generate an interesting pair of graphs.  The upper graph of the two-parter below is one such easily constructed graph.  The red dotted line at the end of the measure period is the current “warming” put in context.

Figure 1. After Professor Bob Carter (lecture at the 10th International Conference on Climate Change at the Heartland Institute on June 12, 2015). Air Temperatures above the Greenland ice cap for the past 10,000 years reconstructed from ice cores using data from Alley, 2000 (The Younger Dryas cold interval as viewed from central Greenland. Quaternary Science Reviews 19, 213-226) (top panel), with a time scale showing years before modern time. Lower panel shows the carbon-dioxide concentrations of the atmosphere over the same period from EPICA Dome C ice core.

The caption of the graph gives the data source for the lower graph: they’re from ice core data collected by the European Project for Ice Coring in Antarctica from the Antarctic Plateau.

A number of things jump out at me about this graphed relationship between temperature and the atmosphere’s CO2 content.

One is the clear cyclical nature of global temperature.  There clearly is more going on with planetary temperature than any putative CO2 pumping.

Another is the absolute lack of relationship between temperature and CO2 in our atmosphere.  Atmospheric CO2 was at its nearby (as such things go on a geologic time scale) low when temperature cycles were achieving apparent highs over the 11,000 years presented.  While atmospheric CO2 has been rising since that low, it has been doing so more or less slowly and steadily, especially compared with the wild (relatively) swings of the temperature cycles.

Another goes back to the upper, temperature graph.  The average planetary temperature over the geologic time frame sure looks like it’s been decreasing, slightly, across the period.  While the atmospheric CO2 content has been rising.

And one more thing: that current rise in temperature represented by that dotted red line.  It’s indistinguishable from any of the other sharp rises into a warm cycle.

Settled, indeed.