A(nother) Thought on Climate…Change

Watts Up With That has a summary article and graph on this; the basic article is on the other side of a link in the summary. It’s typically academic in its language, but it’s well worth a layman’s time in slogging through. Here’s the graph (which is a construction of Watts’; it’s not in the linked-to article):TreeRingSummary
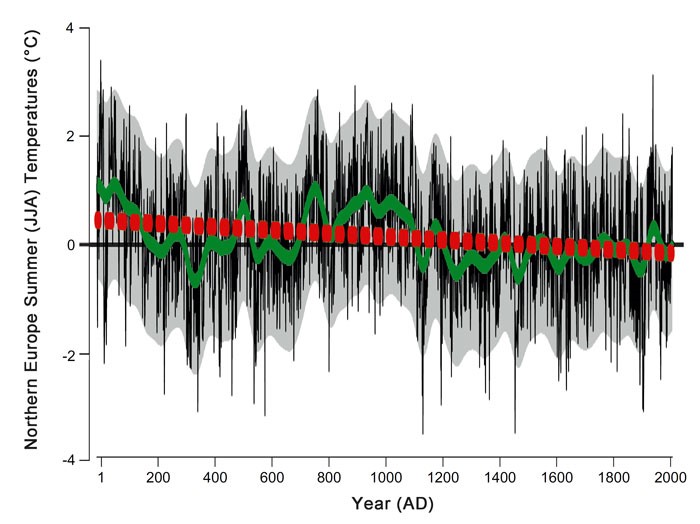
Northern Europe summer (June, July, August) temperature reconstruction. Data shown in °C with respect to the 1961-1990 mean. Adapted from Esper et al. (2014).

The black lines are individual data points, and the grey shading smoothes the data. The green line represents the center of the grey shading, and the red line approximates a regression line showing the long-term rate of cooling over these 2,000 years. All the representations show the same thing: it was warmer in northern Europe 2,000 years ago, during the time of the Roman Empire, than it is today.

The take away for me, though, is what’s represented by the black lines and the grey shading. Compare those to the alleged warming trend of the last 100 years—and its stagnation over the last 20 years (fully a fifth of those 100 years).

Now show that that recent “trend” is distinguishable from the noise level apparent in the data and their first smoothing, the grey shade.

More Actual Facts

…about climate change. In a paper, Atmospheric controls on northeast Pacific temperature variability and change, 1900–2012, released last Monday by the Proceedings of the National Academy of Sciences, roughly translated for us laymen by the AP, authors Jim Johnstone, at the time of his research with the Joint Institute for the Study of the Atmosphere and Ocean at the University of Washington, and Nathan Mantua, research scientist with the NOAA Fisheries Service in Santa Cruz, CA, found that northeast Pacific (that’s abeam the US) ocean warming since 1900 correlates better with naturally occurring wind pattern changes than with any pattern of human greenhouse gas injection into the atmosphere. According to Johnstone,

What we found was the somewhat surprising degree to which the winds can explain all the wiggles in the temperature curve. So clearly, there are other factors stronger than the greenhouse forcing that is affecting those temperatures[.]

Also damaging to the climate panic-mongers’ case were these facts:

[O]ne steep ocean warming period from 1920 to 1940 predates the big increases in greenhouse gases, and an ocean cooling period from 1998 to 2013 came while global average temperatures were at or near all-time highs.

Of course the climate pseudo-science folks demur.

They pointed out that the study sees a correlation but did not do the rigorous statistical and computer analysis to show that the cause of the wind changes were natural—the kind of analysis done when scientists attribute weather extremes to global warming.

This would be the same computer analysis—computer modeling—that has found itself unable to predict, simultaneously, the past and the present, and which predictions of the future have been wildly variable and heavily dependent on the specific values assigned to a myriad of model inputs.

The abstract is here; the full article is behind the PNAS‘ login wall.

“Climate” Again

Texas and California are in the middle of droughts. This is, of course, due to man-caused climate change. Or is it? Watts Up With That has a couple of graphs that bear on the matter.

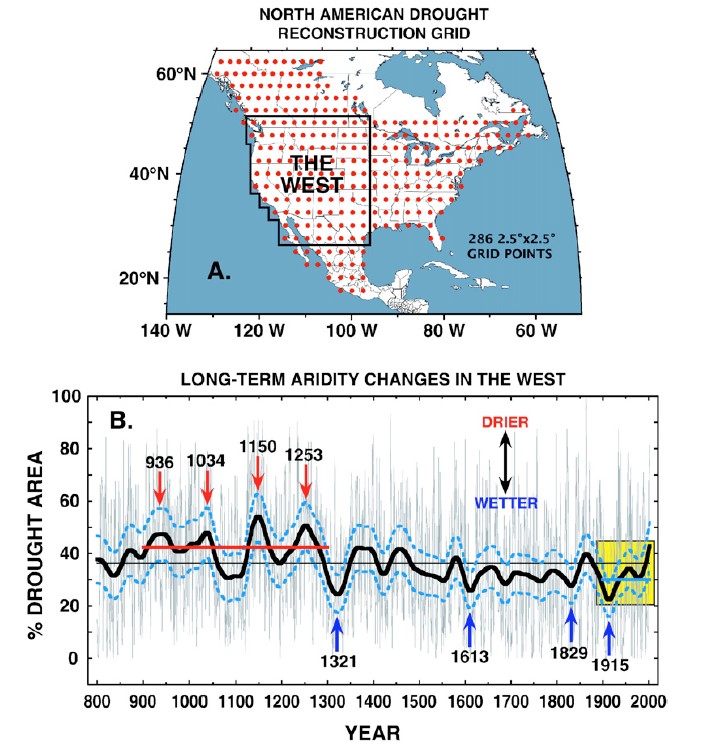
This one gives one idea of the history of droughts and wet periods over the last, oh, say, 1,200 years:NorthAmericaDroughtGrid

The dots in the upper part of the figure give the locations at which measurements were taken. The lower part gives the time history of wet vs dry for the time frame indicated; the dotted lines flanking the solid black line give the error range for the measurements. The shaded yellow area to the right indicates the (limited) time frame of interest to our climate panic mongers. The average dryness for an earlier period (notice that it’s outside the time of interest to our mongers) is shown by the solid red line, and the average wetness is shown by the blue line that’s partially obscured by the yellow shading.

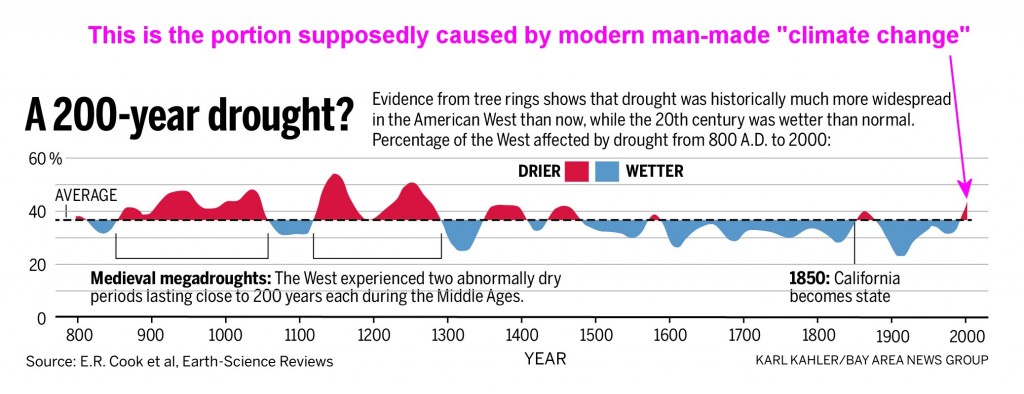
This graph gives a clearer indication of wet and dry periods, including that long time frame so studiously ignored by our mongers. The graph points up California’s strait because Watt’s article was centered on all the nonsense California’s Democrats are spouting about their drought. It pretty much speaks for itself.200YrCaliforniaDrought

The graph’s small text may be hard to read; it says

Evidence from tree rings shows that drought was historically much more widespread in the American West than now, while the 20th century was wetter than normal. Percentage of the West affected by drought from 800 AD to 2000.

Hmm….

Gina “Joe” McCarthy

…is at it again. Operating carefully in the proverbial dead of night, burying its new rule in the 80,000 page Federal Register and unadorned by any other announcement,

The Environmental Protection Agency has quietly floated a rule claiming authority to bypass the courts and unilaterally garnish paychecks of those accused of violating its rules….

The EPA also has fast-tracked passage of this rule in an effort to get it into effect before anyone knows it’s there. Until it’s applied. The EPA has justified the fast-tracking by claiming, with an absolutely straight face, that this isn’t a “significant regulatory action.”

On top of that, Gina “Joe” doesn’t feel any need to explain herself.

EPA officials did not respond to repeated questions by The Washington Times about why they thought it was necessary to garnish people’s wages.

The explanation she’s reluctant to say out loud, though, clearly is, “Courts? We don’t need no courts! I don’t have to take you into any stinkin’ courts!”

Global Warming

Here is how global warming is working out, as described by Tom Harris and Dr Madhav Khandekar at PJMedia:

  • CONUS: third-coldest Decembers and Januaries (that’s 2013 and 2014) in 30 years averaged over the contiguous 48 States; temperatures plummeting to −10°C in Atlanta, −26°C in Chicago, for instance
  • CONUS again: 59% of the contiguous 48 States was snow-covered, first time in 10 years, on 17 Dec
  • North East India: unusually severe snow and −10°C temperatures without home heating
  • Most of India, generally: 2°C-5°C colder than usual
  • Cairo: first snowfall in over a century
  • Jerusalem: fiercest snowstorm in 20 years
  • Berlin: March 2013 was the coldest in 100 years. In the same month, low temperature records were set UK generally: March 2013 had record lows throughout

Even the cold areas of the planet were colder:

  • Antarctica:
    • Record low temperatures
    • Sea ice more extensive than at any time in the modern-day record
  • Arctic:
    • summer sea ice increased by 2.4 million square km in 2013 compared to 2012
    • largest year-to-year increase since satellite records began

Orwellian warming, maybe….