
An Economy

President Obama is campaigning heavily, these days, on the strength of “his” economic recovery.  Let’s look at this recovery.

Peter Ferrera, cited in The Wall Street Journal, writes

From 1947 to 2007, the U.S. economy averaged real growth of 3.2% a year. At that rate, our GDP would double every 22 years. … Last year, U.S. real economic growth was a paltry 1.7%. The current quarter will probably not be much better.

and

[T]he American economy catching up to its long term economic growth trend line would mean the economy booming over the next 10 years with average annual real growth of 4.4%, and then continuing on after that at 3.2% real annual growth.  Ten years of 4.4% real growth would leave the American standard of living, and GDP, over 50% higher than today.  That is the boom this economy has in it naturally, with the right pro-growth policies just getting the government out of the way, and freeing the economy to grow.

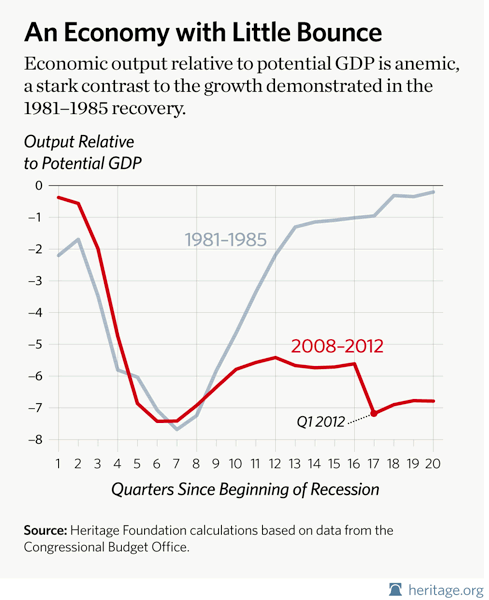
How are Obama’s policies doing?  Typical recession recoveries are faster and higher the deeper the recession from which we’re recovering.  This chart draws a comparison with our nearby history—the recovery from the recession of the ’80s, which was as deep and hard as the present one. The recovery just isn’t there very much.  Unemployment is falling off, and job creation is occurring (more on that below), but it’s anemic.  The zero-line represents full GDP output—our economy is operating on all cylinders—and three years after the ’80s recession’s deepest point, we were at full production.  With the current recession, it’s not even close.  In fact our current growth rate of 2.4% per year since the recession’s formal end in the spring of 2009 is the slowest rate since WWII.
The next three charts look at our labor—our employment—picture in particular.
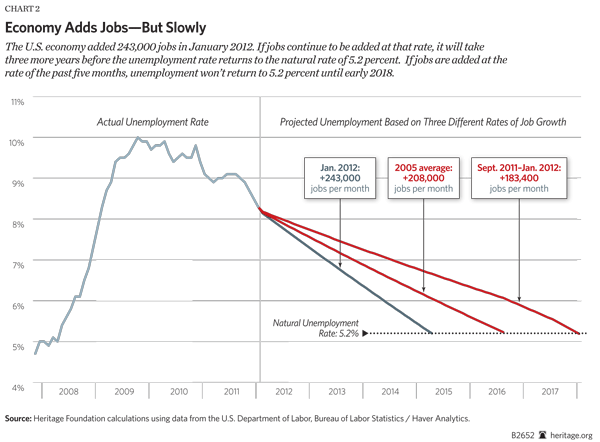
This chart looks at three different growth rates and the time from today to full employment.  If employers continue to add jobs at the same rate they did between September 2011, when unemployment began to improve, and last January—183,400 jobs per month—the unemployment rate won’t reach even 7.8% for another 20 months, December 2013, and will not full employment for five more years: January 2018.  Even if employers add jobs at their 2005 pace, we won’t reach full employment until mid-2016, and if January’s unusual rate is continued, we’re still looking at mid-2015 before reaching full employment.

This next chart gives another look at our future.
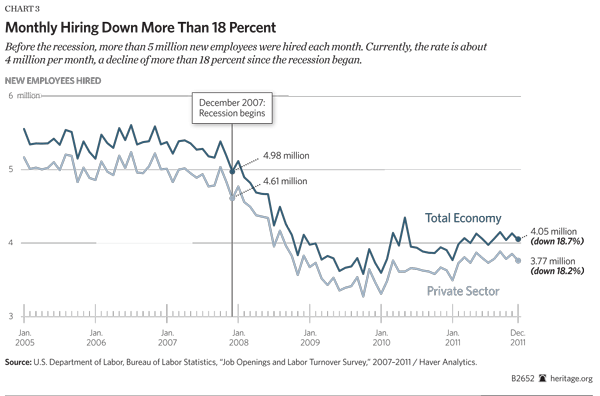
Fewer existing businesses are hiring, and fewer entrepreneurs are starting new businesses; there are fewer jobs for the unemployed.  Moreover, it takes time for startups to grow and to increase their hiring, just as it does existing businesses to recover, resume growing, and increase their own hiring.  Delays now in growth and job creation mean continued delays tomorrow in getting growth going and hiring to increase.

The next chart shows the falling labor participation rate in our current economy.

The present  63.7% of adult Americans active in the labor force (either employed or looking for work) is the lowest participation rate since 1983—when far fewer women were working.  Keep in mind that this historically low participation rate artificially reduces the measured—headline—unemployment rate because folks not looking for work aren’t counted as unemployed.  The Congressional Budget Office estimates that the unemployment rate would be 1.25 points higher—9.45%—if labor force participation were at normal levels.

Finally, how does our current recession…recovery…compare with past recoveries?  This last chart is illustrative.
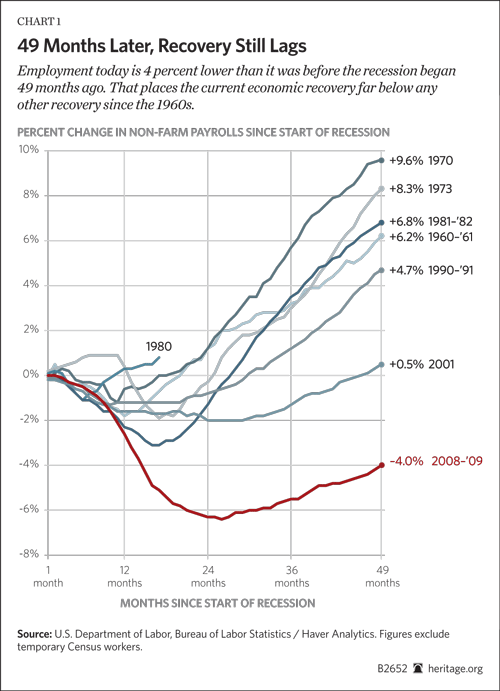
In every prior post-war recession, employment has fully recovered within four years.  As of December 2011—four years after the recession’s onset—payroll employment remains 4.0 percent below the number of workers employed when the recession started in December 2007. Private-sector employment is 4.5 percent below pre-recession levels.  That represents 5.6 million net fewer jobs; 5.2 million of those net job losses occurred in the private sector.

In sum, as The Heritage Foundation points out,

It’s the natural tendency for the economy to grow—and taking credit for its meager improvement is sort of like accepting kudos for the rising and setting of the sun.

We have any sort of recovery at all solely because of that natural tendency to grow.  What are the differences between our current straits and past recession recoveries?  Obama’s policies are of a kind with a prior Progressive President, Franklin Roosevelt.  Both sets of policies centered on expansive, intrusive government, increasingly interfering with the operation of our free market and even going so far as to dictate what individual Americans are permitted—or required—to do in the market place.  All for our own good.  Just as those policies so tragically prolonged the Depression of the ’30s, so are these policies prolonging the current recession’s effects.

On the other hand, when met with shrinking government and reducing personal and business tax rates, as Jack Kennedy (!) and Ronald Reagan, for instance, did, our free market economy responded with rapid, prolonged growth.

I agree with President Obama.  The credit for these three years of historically poor economic performance is entirely his.

Private vs. Government Economic Stimulus

The New Orleans writer Douglas McCollam, in a recent The Wall Street Journal op-ed, described a New Orleans organization that is having an impact on that city’s economic welfare.  The nonprofit organization, Idea Village, it seems, has in its 10 years of existence helped raise $2.7 million

in seed capital for more than 1,100 local entrepreneurs, creating more than 1,000 jobs and $83 million in annual revenue—and these days helping the city’s unemployment rate stay about a point to a point-and-a-half below the national average.

That’s money raised from private sources and voluntarily paid in, not tax money collected by a government.  In addition to Idea Village’s efforts, health care and education are benefitting from private enterprise efforts, rather than government handouts:

Today about 80% of the city’s public schools, formerly among the nation’s worst, are charter schools competing on performance to attract students.  The city’s antiquated Charity Hospital will soon be replaced by a state-of-the-art medical center, part of a larger, 2.4-square-mile medical corridor anchored by a new cancer research facility and BioInnovation Center.

With tax incentives (read tax cuts), New Orleans is about to replace New York City as the second largest venue for making feature films (Los Angeles remains No. 1).

Look again at Idea Village.  In its 10 years, it’s returned on those $2.7 million 30 times that amount in annual revenue.  And those jobs have cost $2,700 per each.

How does that private stimulus money raising and spending compare with government stimulus money taxing and spending?

President Obama and Vice President Biden are constantly claiming that Obama’s Stimulus spending has “created or preserved” millions of jobs in just three years.  They have steadfastly refused, though, to provide any evidence that that’s true, or that jobs created or preserved are the result of that trillion-dollar spending spree in 2009 and not the result of a struggling, otherwise ordinary, business recovery cycle—beyond anecdotal claims from state agencies beholden to the Obama administration for that money and for other billions they each hope to get in the future.

Let’s accept arguendo that the Obama claims are reasonably accurate, though.  $1 trillion dollars from the Stimulus Bill of three years ago has created or saved 3.2 million (the most frequently tossed about number) jobs in these last three years.  That works out to $312,500 per job created or saved.  Sorting out only the created jobs (were that possible) would drive that cost per job even higher.

And the return on those trillion dollars isn’t at all positive.  Meanwhile, the unemployment average remains, three years after Obama’s promise, above 8%.

Hmm….

Pause for Commercial

My book, A Conservative’s Manifesto: A Brief Discussion of some Principles, has been published, and it can be found, among other places, at Amazon.com (paperback, Kindle, or hardcover) and at Barnes & Noble (paperback, Nook, or hardcover). Links also can be found nearby in the column to the right and on the newly added Books page.

The book lays out, in so many words, a set of (modern) Conservative principles that are tied back to the 18th Century Liberal principles that guided our Founding Fathers in developing our American social compact.  I begin with a description of those 18th Century Liberal principles and continue with a description of our drift away from them over the last 80 years, beginning with FDR’s administration.  I also describe a modern Conservatism that is those 18th Century Liberal principles brought forward to today, and I apply those principles to a number of critical aspects of American life: faith, citizenship, the nation, our economy, and our government.  I close by contrasting modern Liberal/Progressive concepts with these modern Conservative concepts and offering a path back to those modern Conservative tenets that made our country so exceptional and so great.

I hope you find it both enjoyable and useful.

Labor Costs and Big Spending

Karl Rove, former senior adviser and deputy chief of staff to President Bush the Younger, wrote in last Thursday’s Wall Street Journal about President Obama’s campaign fundraising and spending.  Of particular interest to me, he had this:

The Obama campaign’s high burn rate doesn’t come from large television buys, phone banks or mail programs that could be immediately stopped.  It appears to result instead from huge fixed costs for a big staff and higher-than-expected fund-raising outlays.  These are much tougher to unwind or delay.  Left unaltered, they generally lead to even more frantic efforts to both raise money and stop other spending.

Doesn’t that sound an awful lot like public service unions and their drain on the taxpayers’ dollars?  Is there a pattern here?

Energy Taxes

The oil and gas industry paid, as recently as 2009, nearly $36 billion in corporate income taxes, a value roughly equal to 10% of the Federal government’s non-defense discretionary spending.

Moreover, the Tax Foundation estimates that, between 1981 and 2008, the oil and gas industry paid $1.45 in those corporate income taxes for every dollar of profit earned domestically.

On top of this, President Obama’s 2013 budget proposal contains tax increases that would drive the tax bite up by an additional $44 billion over the next 10 years—Executive Office accounting—or by $85 billion, according to the American Petroleum Institute.

On the other hand, the tax bite for the nuclear power industry is nearly a dollar of American taxpayers’ money paid to the nuclear power companies for every profit dollar those companies earn.  Wind power companies get from us taxpayers payments of $1.64 for every dollar of profit, and solar power companies hit us up for $2.45 for every dollar of profit.  Green energy, indeed.

Who is it that’s not paying its “fair share?”  Energy Secretary Steven Chu and Obama claim to have seen the light and “no longer share that view” concerning rising gasoline prices, and presumably the pricing of oil and gas generally out of our economy.

Who can believe them in the face of these facts?