
The Uselessness of Obamacare

Here’s another example of the ineffectiveness of the Obama administration—of government generally—as a business manager. HHS’ Office of the Inspector General conducted a review of ObamaMart’s performance last fall and early winter—from October through the end of December—although it didn’t include four ObamaMart centers that chose not to comply with the IG’s request for information.

As of the first quarter of 2014, the Federal marketplace [ObamaMart] was unable to resolve about 2.6 million of 2.9 million inconsistencies because the CMS eligibility system was not fully operational. It was unable to resolve inconsistencies even if applicants submitted appropriate documentation.

Moreover,

These inconsistencies pertained to citizenship, national status, and lawful presence; income; and employer-sponsored minimum essential coverage.

These are things that determine whether a citizen must buy a government-approved health plan, and if so whether that citizen is eligible for taxpayer subsidy for the premiums.

And there’s this [emphasis added]:

[ObamaMart] was capable of resolving more than 330,000 inconsistencies with Social Security number, non-employer minimum essential coverage, incarceration status, and whether the applicant is an Indian. However, during the same reporting period, the Federal marketplace reported that it had actually resolved only about 10,000 such inconsistencies, or less than 1 percent of the total.

The thing isn’t even capable of collecting quality control data.

[ObamaMart] could not determine the number of applicants who had at least one inconsistency. Rather, the Federal marketplace reported unique inconsistencies, and it could not determine the corresponding number of applicants because one applicant could have more than one inconsistency. As a result, it was not possible at the time of our evaluation to determine the extent to which inconsistencies are distributed across applicants in the Federal marketplace.

Marketplaces also reported that data on inconsistencies may be overstated. Some marketplaces reported that failures with eligibility systems allowed applicants to submit multiple applications. In these instances, each application could be processed and cause the same inconsistencies to occur and be counted.

There were a number of examples; I only excerpted the one.

Just wait until tax time next April when these failures will come home to roost. Who’s got the government-approved plan? Who’s (still) eligible for taxpayer subsidy? Who owes the government a refund because he wasn’t eligible for that taxpayer subsidy, or wasn’t eligible for so much? Not even the Shadow knows.

But the ones who’ll be hurt the most will be the little guy, barely making ends meet and forced to buy a plan he neither needed nor wanted, and the little guy who must pay back the subsidy for which he wasn’t actually eligible.
The Obama Recovery

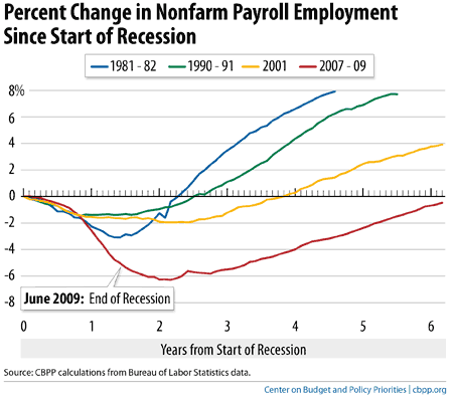
Here are some graphs of how well President Barack Obama’s regulations and economic policies have been working since he exploded our national debt with his “Stimulus” package in 2009. The graphs come from Southern Methodist University Cox School of Business’ Maguire Energy Institute.

First, the sad classic graph of how the Obama Recovery compares with past recession recoveries. It speaks for itself.RecoveryComparison_Cox

This graph shows the total number of Americans still unemployed—the flip side of the number of Americans who actually have jobs.TotalUnemployed_Cox

Like the classic above, things are improving—hence “recovery”—but unemployment still is at historic highs when we consider the number of Americans that make up the unemployed 6.3%. This is because our population is growing faster than the number of jobs available.

This graph shows that the length of time Americans are unemployed isn’t improving very much at all. See the bit about jobs not being created fast enough, above, for a major contributor to this failure. This is a problem that tends to be self-perpetuating, too. The longer folks are out of a job, the more of their skills they lose; if they were in a high-skill, and/or information intensive job (engineering comes to mind), the more obsolete they become, too, as they aren’t as able to keep up with the new data in their field as are those still employed—or even the newly graduated.UnemploymentDuration_Cox

And one more:ProductivityGrowth_Cox

Productivity growth, output per hour by an employee, or what he produces in his hour of working, isn’t very much at all. Most of the jobs that are being created in this pseudo-recovery are service jobs. There are only so many tables a waitress can handle in an hour, only so many disgruntled customers a Customer Service Representative can handle in an hour, only so many investors a brokerage’s Investment Advisor can handle in an hour.

This…recovery…is, to use the Institute’s term, anemic. But we knew that from last week’s GDP growth number. And all of you still looking for work, or who’ve given up on that, have known this for some time.

Some Empirically Determined Pipeline Benefits

A study prepared by the SMU/Cox’ Maguire Energy Institute for the Consumer Energy Alliance has some interesting data from the Keystone XL leg that connects Cushing, OK, with Nederland, TX (built because it’s a purely domestic leg and so did not require President Barack Obama’s personal approval). The figure below presents a map of the pipeline and some proposed adjuncts to it. The Gulf Coast Project is the section of the Keystone XL pipeline project that connects the two towns, and it was open for business last January, so the empirical data are current.Keystone-System-Map

Here are some of the short-term benefits of the project’s work and a couple of longer term benefits:

  • $2.3 billion in private-sector investment
  • 11 million+ hours of labor completed by 4,844 American workers
  • 50+ contracts with US manufacturers and companies that built the pipeline and associated equipment, spread across the country: Arkansas, California, Georgia, Indiana, Kansas, Louisiana, Maryland, Michigan, Minnesota, Missouri, New York, Ohio, Oklahoma, Oregon, Pennsylvania, South Carolina, and Texas
  • manufacture of 485+ miles of high-strength, advanced oil pipeline (36-inch diameter) and associated equipment: thousands of pieces of equipment used to build transformers, meters, electric motors, cabling and electrical equipment; piping assembling and structural steel for supports; etc
  • 2.25 million barrels of new oil storage capacity at Cushing
  • 6 modern pump stations

Some broader results of the pipeline:

  • pumped $3.6 billion into the Texas economy, $2.1 billion into the Oklahoma economy
  • boosted local tax revenues by millions of dollars
  • Prague, OK: “doubled our city sales tax receipts”
  • full RV parks from the construction effort contributed as much as $8,000 a month in electricity fees alone to the municipal utility
  • tax revenue available—and used—to improve education, local infrastructure, and public services
  • Local restaurants, hotels, and businesses experience a significant boos

This table summarizes the overall economic impact of the project:

  Oklahoma Pipeline Impacts Texas Pipeline Impacts
Total Economic Activity $2,143,364,856 $3,638,561,905
Labor Income $1,041,174,418 $1,696,054,834
Employment (person years) 15,852 26,924
Total Taxes $72,384,852 $144,992,343
Indirect Business Taxes $50,339,639 $112,533,584
Direct Business Taxes $22,045,213 $32,458,759

Many will argue that most of these effects will disappear in a few years, even as soon as the pipeline builders leave. Since the results are temporary, why bother, especially given the risks of an oil pipeline? Leaving aside the fact that pipelines are safer than trains for transporting oil and natural gas, ask the folks who’ve gotten these “temporary” fiscal results whether they think any of it was “worth it.”

Status of Obamacare Six Months In

The preliminary results are not promising. And unsurprising.

Among those health-law marketplace enrollees who have seen a doctor or other health-care provider in the first quarter of this year, around 27% have significant health issues such as diabetes, psychiatric conditions, asthma, heart problems or cancer, the data show. That is sharply higher than the rate of 16% for last year’s individual-consumer market over the same time frame, according to the data[.]

It is also more than double the rate among people who held on to their existing individual policies; among those enrollees, the rate was 12%.

This was well understood and predicted from the jump by those (not only on the right) who viewed the matter objectively rather than through the lens of must-pass because it’s the Progressive thing to do.

Look for sharply higher premiums this summer and fall.

The Obama Recovery is in Full Swing

We’re booming now, in our post-Panic of 2008 recovery, so much so that the Fed lowered its expectation for the US’ 2014 GDP growth to 2.2%—a sharp reduction of their 2014 estimate of just three months ago of 3%.

Oh, wait—did I say “booming?” Hmm….

As a beer ad once said, with a different slant, it doesn’t get any better than this. Not with Democratic policies.