Much is made of the need for subsidies for things that are too expensive for people/businesses to get into on their own—college and solar energy for example. After all, if folks want into these enterprises, they’re at all useful, but folks can’t afford to get involved, a taste from government to help them out is good, right? I’ll leave aside the question of whether such an endeavor actually is useful; it’s not relevant to whether subsidies are beneficial.
The figure below, which comes from OnlineTexts shows in stark terms the effect of a subsidy. The P and Q (which we always should mind) on the graph’s axes are economist-speak for Price and Quantity. The line labeled S is a supply line, which simply shows generically how the price of a thing varies with its supply: as the price increases, producers will produce more (no, it does not indicate that as producers make more, the price they can get goes up). The two lines labeled D1 and D2 show before and after conditions of how price varies with demand for that same thing: for each line, as price goes down, more people want that thing. The points labeled A and B simply show hypothetical equilibrium price and quantity for the two demand conditions—the price at which, in theory, everyone gets to buy that thing, and no one is left out; and after all that buying and producing, no single example of that thing is left over, every one produced has been bought. Each D line represents a different population interested in buying that thing.
It’s useful to note that supply lines can shift, also; however, in most cases demand can change faster than supply so that supply will change after and in response to that demand shift. The change from D1 to D2 occurs today; S will not shift until tomorrow—it takes time to add factories, hire and train workers, and so on. S will, tomorrow, shift either to the right or to the left, depending on the producers’ actual reaction to the demand shift. 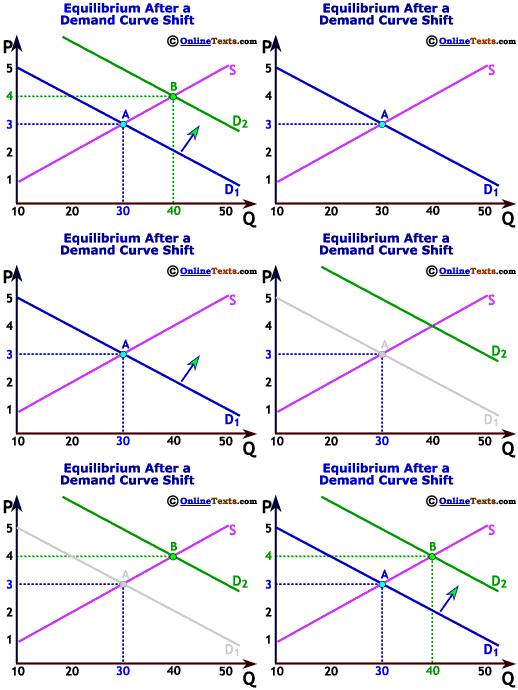
So what does this graph tell us about the effect of subsidies on the cost to all of us of the subsidized thing? The folks on the D1 demand line represent the folks that can afford to buy the good today—pay for college, build an electricity generating station that uses solar energy exclusively, buy that solar energy-produced electricity for their homes, and so on.
The price for these on D1—Point A—is deemed by government to be too high; more folks “should” be buying these goods. Government wants to help, so it offers a subsidy for the good.
It doesn’t matter what form that subsidy takes, whether it’s a direct payment to the buyer for the purpose of a specific purchase, a tax deduction—or credit, an even larger subsidy—after the fact for having made that purchase, a payment to the producer/seller for offering the thing at a “reduced” price for certain buyers, etc. As a result of the subsidy, the population of folks who are interested in buying that thing changes—it expands—and the demand line shifts to the right: D1 moves to D2. Everyone is happy, right? But what happened to the price? It went up: the equilibrium price now is at Point B. Despite a larger quantity of the thing being available with current production facilities, the price everyone—subsidized and not subsidized—now is paying increased. After the subsidy was provided, everyone began paying a higher price than anyone was before the subsidy was provided. There’s more money available with which to buy that thing, so the sellers/producers are able to charge more.
Sure, the subsidized person is paying a relatively reduced price out of pocket, but to the extent he pays taxes—now or in the future—he’s paying a higher price when those taxes are added back in. And those taxes are inevitable: either they’re current taxes to pay for the current subsidy, or they’re future taxes to pay for the current borrowing that provides the subsidy. But the unsubsidized person also now is paying a higher price, both out of pocket and through those taxes.
This isn’t theoretical. As Eric Falkenstein notes on his blog,
Federal college aid has risen 165% over the past decade, and college and college costs have risen about 74% over that same period.
Moreover, as recently as FY2007 (pre-Obama explosions) Federal subsidies for solar-generated electricity amounted to $24.34 per megawatt-hour and $23.37 per megawatt-hour for wind, compared with $0.44 for conventional coal and $0.25 for natural gas and oil. In fiscal year 2010, the subsidies were $775.64 for solar power and $56.29 for wind, but for coal, natural gas, and oil were still only $0.64. Higher subsidies have exploded the total cost of solar and wind energy.