
Texas and California are in the middle of droughts. This is, of course, due to man-caused climate change. Or is it? Watts Up With That has a couple of graphs that bear on the matter.
This one gives one idea of the history of droughts and wet periods over the last, oh, say, 1,200 years: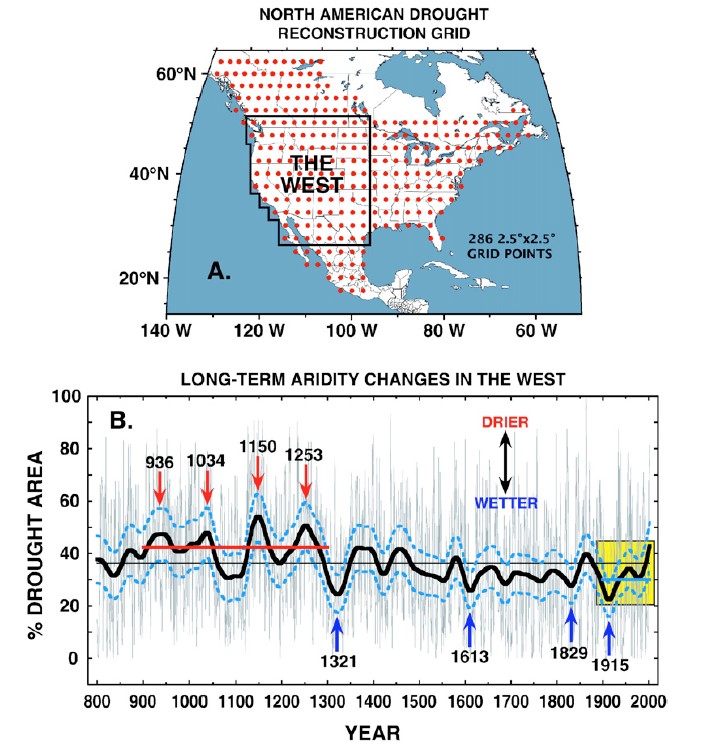
The dots in the upper part of the figure give the locations at which measurements were taken. The lower part gives the time history of wet vs dry for the time frame indicated; the dotted lines flanking the solid black line give the error range for the measurements. The shaded yellow area to the right indicates the (limited) time frame of interest to our climate panic mongers. The average dryness for an earlier period (notice that it’s outside the time of interest to our mongers) is shown by the solid red line, and the average wetness is shown by the blue line that’s partially obscured by the yellow shading.
This graph gives a clearer indication of wet and dry periods, including that long time frame so studiously ignored by our mongers. The graph points up California’s strait because Watt’s article was centered on all the nonsense California’s Democrats are spouting about their drought. It pretty much speaks for itself.
The graph’s small text may be hard to read; it says
Evidence from tree rings shows that drought was historically much more widespread in the American West than now, while the 20th century was wetter than normal. Percentage of the West affected by drought from 800 AD to 2000.
Hmm….