France and the US

Guy Milliere has an interesting article on the French elections last Sunday and on the decline of a once proud nation (the article was written before the elections, but what he wrote remains valid today–RTWT).

Milliere decries the failure of France and sees its present strait as no better than the precipice, beginning with:

…among the 10 candidates in the first round [of the French presidential elections last month], three were Trotskyites advocating a Leninist revolution; a disciple of Lyndon La Rouche; a former Norwegian judge who appears to think she is an environmental Robespierre (Eva Joly); a populist from the extreme right (Marine Le Pen); a moderate who would find his place in the left wing of the American Democratic Party (François Bayrou); a Gaullist speaking as if it were still 1965 (Nicolas Dupont Aignan); a very « socialist » Socialist (François Hollande); and the outgoing President Nicolas Sarkozy, a Bonapartist who, in the UK, would be to the left of the Labour Party.

At least with a two-party system (and occasional third-party spoiler) like ours (or even a three-party system with occasional spoiler flashes in the pan, as in Great Britain), the fringe groups don’t have much post-election effect, beyond the spoiling aspect of turning an election from one main party to the other.

But Milliere continued:

…no candidate defended free-market principles;…all of the candidates harshly attacked the financial world, multinational corporations, and globalization;…of the two finalists, one[‘s]… program appears to have been written before the development of the Internet.

Now we get to the parallels.  President Obama’s hostility toward free market principles, and toward business generally and banks explicitly, are both manifest (his claims to the contrary even as he follows them with screeds against the fat cats notwithstanding) and rooted in (and unchanged from) the late ’60s and early ’70s radical “community organizing” of his mentors.

Milliere went on:

France’s problems date from long before the presidency of Nicolas Sarkozy.  [It is a] country where no budget has been balanced since 1974, and where public expenditures have risen continuously in recent decades to represent a crippling 56% of its gross domestic product….  It is a country whose public debt is growing far faster than the public debt of its main economic partners in Europe, and will hit 87% of GDP this year (actually 146%, if what France owes to the European Union is included).  It is a country where reports on the inevitable failure of pension systems were presented to successive governments for over 25 years without a decision being proposed or taken.  It is a country where the…number of people living in poverty is between eight and ten million out of a population of 65 million.  It is also a country where…two-thirds of all higher education diplomas are worthless on the labor market.  Graduates with Master’s degree become fast-food servers or cashiers in a supermarket—if a position is available.

So it is in the US.  Our current economic disaster has been years, and administrations, in the making: very few actually balanced (as opposed to accounting gimmick balancing) budgets and national debt exploding over the last three years.  We’ve been ignoring the impending failure of our entitlement programs for decades, even though the originally forecast date range of their bankruptcy has moved very little in all that time.  Nearly 45 million Americans are currently receiving food stamps, which is roughly the same 14% of our population as is Milliere’s Frenchmen living in poverty; although, according to the CBO report at the link, that number is 70% higher than it was in 2007, immediately before the housing bubble burst.  And we insist on loaning taxpayer monies to students who wish to degree in gender studies, women’s contemporary literary issues, or basket weaving instead of in the productive STEM skills that a burgeoning and technologically evolving economy needs for national survival.

It’s necessary to change course.  And that course change must be in the direction of smaller, limited government that leaves more of our money, and our responsibility, in our hands.

Or we’ll end up like France.
Tomorrow!

President Obama once said that if he doesn’t turn our economy around, he would be a one-term president.  Now he says that the question

is not just about how we’re doing today, it’s about how we’re doing tomorrow.

But as the Progressive’s hero, John Maynard Keynes once said

In the long run we are all dead.

Indeed.  Americans are hurting today.  Today, the labor force is shrinking to historic lows as people give up on finding a job.  Today, people can’t pay their bills.  Today, people are losing their homes.  Today, people are becoming ever more dependent on food stamps.

No, as Obama said in another of his sound-bite slogans, “We can’t wait” for tomorrow.

Tomorrow, Tomorrow, I love you, tomorrow
You’re always a day away

Unemployment and Unemployment

Last Friday, the Bureau of Labor Statistics jobs data were released.  Superficially, they seem encouraging—the unemployment rate dropped a tenth of a point to 8.1%, the lowest rate since the month of President Obama’s inauguration.  Moreover, nonfarm payroll employment rose by net 115,000 (130,000 new private sector jobs against a loss of 15,000 government sector jobs).  But the data behind these numbers are appalling.

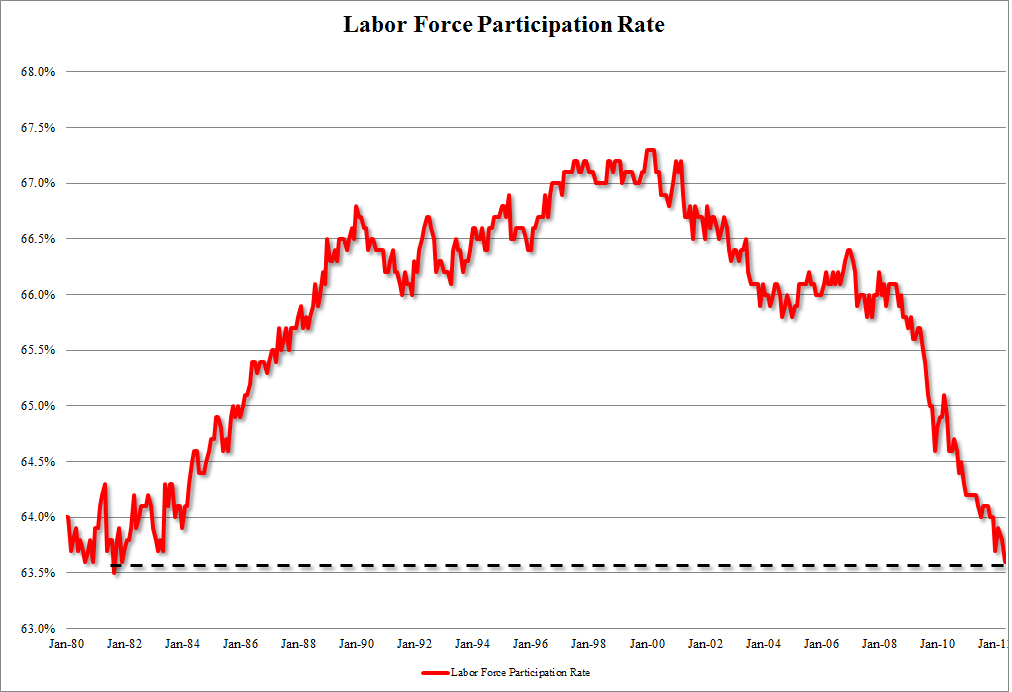
By April, the number of people not in the labor force at all had risen to nearly 88.5 million, the highest non-participation rate on record.  Indeed, this is a rise of over half a million (ex-) workers just since the March data release.  This has driven the labor force participation rate—the per centage of our population that hasn’t yet given up and are still actively working or looking for work, to 64.3%, a 30-year low.  Other estimates confirm this: 342,000 people dropped out of the labor force, while the ranks of the unemployed fell by just 173,000.

The Wall Street Journal also reported [emphasis added]

Friday’s report was weak across categories.  Manufacturing employment, an area of strength in recent months, grew by a disappointing 16,000 jobs.  Construction employment fell slightly.  Full-time employment plunged by more than 800,000 jobs.

That’s why that headline unemployment rate dropped.  The unemployment ratio is a fraction consisting of the number of people out of work divided by the number of people working or looking for work, and more people gave up and left the work force—became non-persons in the eyes of the Government’s jobs bean counters—than found jobs.  The number of people left who are working or looking for work shrank precipitously.

A couple of pictures illustrate the story.  (The graphs might be a little hard to read.  The Labor Force Participation Rate graph is in two-year increments from January 1980, and the Persons Not In Labor Force is in three-month increments from December 2007.)

The number of folks wanting to work, that labor force participation rate, rose rapidly in the optimism of the Reagan economic boom into the dot-com bubble.  When the bubble burst, participation rate fell off, but was recovering during Bush the Younger’s second term (when his own tax cuts were starting to take effect) until the Barney Frank housing bubble burst.  And during the Obama administration, the participation rate has fallen off a cliff, as more and more Americans give up due to the current administration’s policy failures and stop looking altogether for work.

Beginning with that housing bubble starting its failure, the population no longer in the work force began running up more steeply, and it’s continued without break throughout the present administration’s set of “economic” policies.


h/t GayPatriot

Where in the World is Osama bin Laden?

Jose A. Rodriguez, Jr, a 31-year veteran of the CIA and the author of Hard Measures: How Aggressive CIA Actions After 9/11 Saved American Lives, has some thoughts on our ability to answer this question a year ago.

This administration built on work pain­stakingly pursued for many years before Obama was elected—and without this work, Obama administration officials never would have been in a position to authorize the strike…that resulted in bin Laden’s overdue death.

Some of that work consisted of things President Obama considered more unsavory than assassination.

In 2004, an al-Qaeda terrorist was captured trying to communicate with Abu Musab al-Zarqawi…. That captured terrorist was taken to a secret CIA prison—or “black site….”  After being subjected to some “enhanced interrogation techniques”—techniques authorized by officials at the most senior levels of the US government—the detainee became compliant.  …he told us many things—including that bin Laden…depended solely on a single courier who went by “Abu Ahmed al-Kuwaiti.”

Culminating, ultimately, in this:

…the CIA was able to discover the true name of the courier.  Armed with that information, the agency worked relentlessly to locate that man.  Finding him eventually led to tracking down and killing bin Laden.

In sum,

…the trail to bin Laden started in a CIA black site—all of which Obama ordered closed, forever, on the second full day of his administration—and stemmed from information obtained from hardened terrorists who agreed to tell us some (but not all) of what they knew after undergoing harsh but legal interrogation methods. Obama banned those methods on Jan. 22, 2009.

Because Obama Knows Better.

Others also have objected to Obama’s arrogance.

Subsidies and Costs

Much is made of the need for subsidies for things that are too expensive for people/businesses to get into on their own—college and solar energy for example.  After all, if folks want into these enterprises, they’re at all useful, but folks can’t afford to get involved, a taste from government to help them out is good, right?  I’ll leave aside the question of whether such an endeavor actually is useful; it’s not relevant to whether subsidies are beneficial.

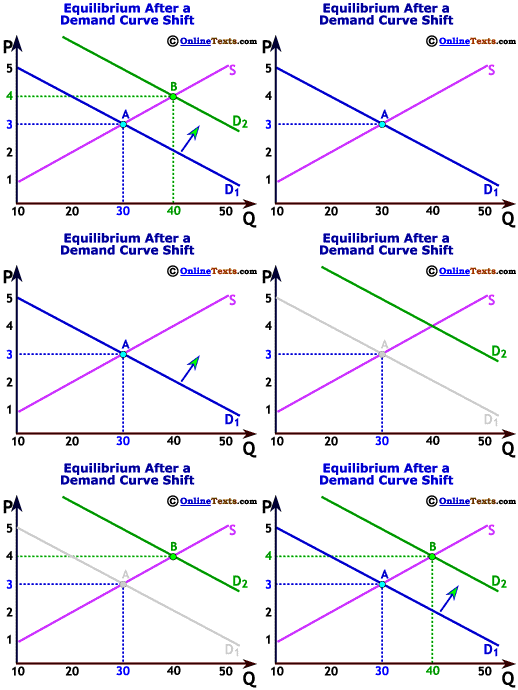
The figure below, which comes from OnlineTexts shows in stark terms the effect of a subsidy.  The P and Q (which we always should mind) on the graph’s axes are economist-speak for Price and Quantity.  The line labeled S is a supply line, which simply shows generically how the price of a thing varies with its supply: as the price increases, producers will produce more (no, it does not indicate that as producers make more, the price they can get goes up).  The two lines labeled D1 and D2 show before and after conditions of how price varies with demand for that same thing: for each line, as price goes down, more people want that thing.  The points labeled A and B simply show hypothetical equilibrium price and quantity for the two demand conditions—the price at which, in theory, everyone gets to buy that thing, and no one is left out; and after all that buying and producing, no single example of that thing is left over, every one produced has been bought.  Each D line represents a different population interested in buying that thing.

It’s useful to note that supply lines can shift, also; however, in most cases demand can change faster than supply so that supply will change after and in response to that demand shift.  The change from D1 to D2 occurs today; S will not shift until tomorrow—it takes time to add factories, hire and train workers, and so on.  S will, tomorrow, shift either to the right or to the left, depending on the producers’ actual reaction to the demand shift.

So what does this graph tell us about the effect of subsidies on the cost to all of us of the subsidized thing?  The folks on the D1 demand line represent the folks that can afford to buy the good today—pay for college, build an electricity generating station that uses solar energy exclusively, buy that solar energy-produced electricity for their homes, and so on.

The price for these on D1—Point A—is deemed by government to be too high; more folks “should” be buying these goods.  Government wants to help, so it offers a subsidy for the good.

It doesn’t matter what form that subsidy takes, whether it’s a direct payment to the buyer for the purpose of a specific purchase, a tax deduction—or credit, an even larger subsidy—after the fact for having made that purchase, a payment to the producer/seller for offering the thing at a “reduced” price for certain buyers, etc.  As a result of the subsidy, the population of folks who are interested in buying that thing changes—it expands—and the demand line shifts to the right: D1 moves to D2.  Everyone is happy, right?  But what happened to the price?  It went up: the equilibrium price now is at Point B.  Despite a larger quantity of the thing being available with current production facilities, the price everyone—subsidized and not subsidized—now is paying increased.  After the subsidy was provided, everyone began paying a higher price than anyone was before the subsidy was provided.  There’s more money available with which to buy that thing, so the sellers/producers are able to charge more.

Sure, the subsidized person is paying a relatively reduced price out of pocket, but to the extent he pays taxes—now or in the future—he’s paying a higher price when those taxes are added back in.  And those taxes are inevitable: either they’re current taxes to pay for the current subsidy, or they’re future taxes to pay for the current borrowing that provides the subsidy.  But the unsubsidized person also now is paying a higher price, both out of pocket and through those taxes.

This isn’t theoretical.  As Eric Falkenstein notes on his blog,

Federal college aid has risen 165% over the past decade, and college and college costs have risen about 74% over that same period.

Moreover, as recently as FY2007 (pre-Obama explosions) Federal subsidies for solar-generated electricity amounted to $24.34 per megawatt-hour and $23.37 per megawatt-hour for wind, compared with $0.44 for conventional coal and $0.25 for natural gas and oil.  In fiscal year 2010, the subsidies were  $775.64 for solar power and $56.29 for wind, but for coal, natural gas, and oil were still only $0.64.  Higher subsidies have exploded the total cost of solar and wind energy.