
Some Thoughts on Energy Policy

The administration’s rap is that we only have 2% of the world’s oil reserves, and there’s that fossil fuel pollution problem, so we have to push green energy sources (which President Obama masquerades as an “all of the above” energy policy).

The good folks at the Institute for Energy Research have a different take on the matter.

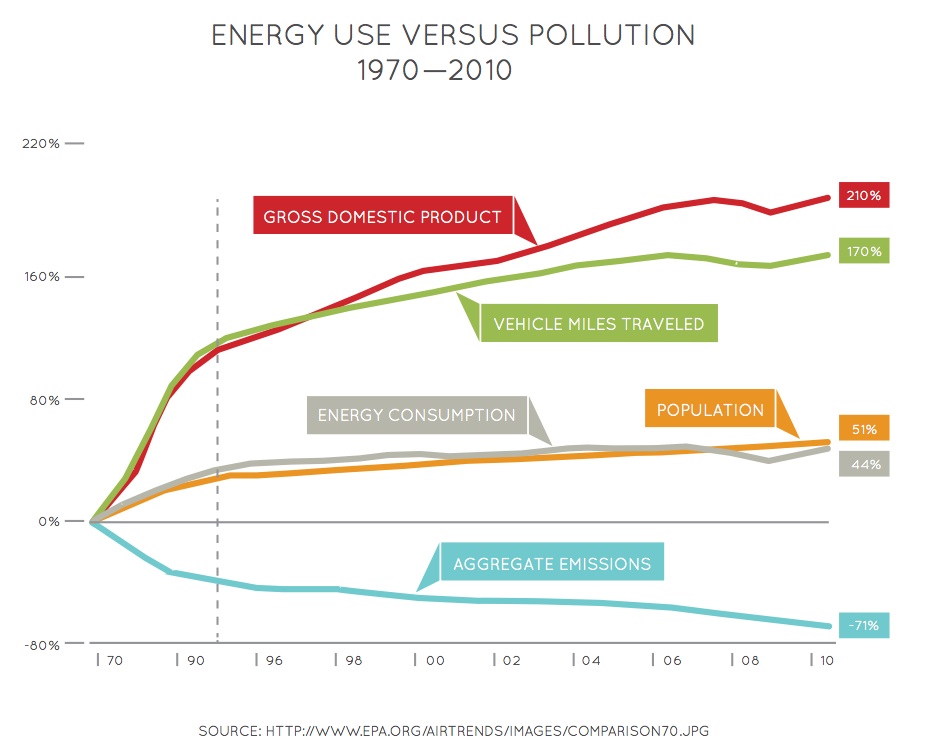
The figure below is a graph showing American population growth, energy use, economic performance, and pollution (emissions) rate since 1970 (the vertical dotted line is simply a break in the time scale from 20-year increments to 2-year increments).  It’s interesting to note that energy consumption per capita has been remarkably constant over these last 40 years.  Meanwhile, our GDP has gone up sharply, so that our energy use per unit of GDP—per unit of economic performance—has gone down sharply as we produce and use our energy more efficiently.  Also over that same time frame, our pollution rate—per capita and per unit of GDP—has gone…down.
Now, what about those miniscule reserves?

The reality is that we have more combined oil, coal, and natural gas resources than any other country on the planet. We have enough energy resources to provide reliable and affordable energy for decades, even centuries to come. The only real question is whether we will have access to our abundant energy resources, not whether sufficient resources exist. … According to the Congressional Research Service, we have the most fossil fuel resources of any country on Earth, but most of these resources are off-limits due to federal policies.

Indeed,

  • The United States is home to the richest oil shale deposits in the world—estimates are there are about 1 trillion barrels of recoverable oil in U.S. oil shale deposits, nearly four times that of Saudi Arabia’s proved oil reserves.
  • The United States has 261 billion tons of coal in its proved coal reserves. These are the world’s largest coal reserves and over 27 percent of the world’s proved coal reserves.
  • The United States has 486 billion tons of coal in its demonstrated reserve base [measured quantity of [coal] which, based on the geological and engineering data supporting proved energy reserves, can be recovered with presently available technology at an economically viable cost], enough domestic coal to use for the next 485 years at current rates of consumption. These estimates do not include Alaska’s coal resources, which according to government estimates, are larger than those in the lower 48 states.
  • The federal government leases less than 3 percent of federal lands for oil and natural gas production—2.2 percent of federal offshore areas and less than 5.4 percent of federal onshore lands.

This graph shows one impact of government intervention in energy production.
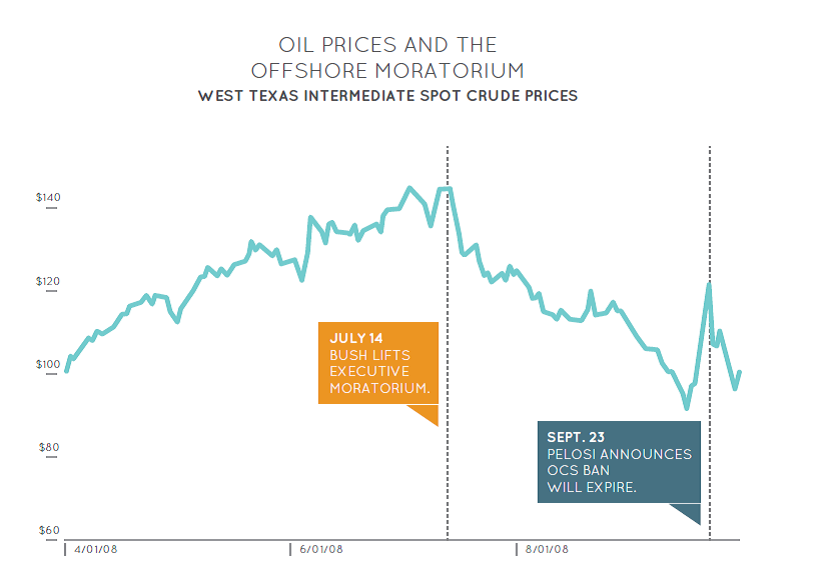
Notice the price drops when government intervention is reduced.  On top of this, the Federal government leases less than 3% of its lands for oil and natural gas production—2.2% of Federal offshore areas and less than 5.4% of federal onshore lands.  Finally,

Total federal subsidies in fiscal year 2007 were $24.34 per megawatt hour for solar-generated electricity and $23.37 per megawatt hour for wind, compared with $1.59 for nuclear, $0.67 for hydroelectric power, $0.44 for conventional coal, and $0.25 for natural gas and petroleum liquids. In fiscal year 2010, the subsidies were even higher. For solar power, they were $775.64 per megawatt hour, for wind $56.29, for nuclear $3.14, for hydroelectric power $0.82, for coal $0.64 and for natural gas and petroleum liquids $0.64.

My energy policy? Pretty much akin to “Drill, Baby, Drill.”  And export the excess.  Push for more nuclear power plants.  Three Mile Island demonstrated that our safety systems work, even in extremis.  Encourage wind and solar farms, but not with those—or any—subsidies (eliminate those trifling subsidies for the other energy sources, too).  The free market will decide the economic viability of our sources of energy, and the free market is the only mechanism qualified to determine what is economically sound among the several energy sources.


h/t Power Line

National Defense in Asia

Japan has begun taking a more aggressive approach to its national defense and to its partnership with the US in regional defense.  This may be spurred by the People’s Republic of China’s naked aggression in the South China Sea against the Republic of the Philippines and their threats against the Socialist Republic of Vietnam over the latter’s activities in the Sea.  This may be spurred by northern Korea’s attempted launch of an ICBM—Japan had already announced they’d attempt to shoot it down if its path were over/toward Japan.  This may be spurred by the fact that the PRC said last March that it plans to increase defense spending over 11% in 2012, making their defense spending second highest in the world after the our own.

Adding to this is the US talking more aggressively about our own self- and regional-defense responsibilities.  A newly appointed Assistant Secretary of Defense for Asia and Pacific affairs will give “serious consideration” to the sale of F-16 C/D fighters to the Republic of China (recall that this administration last September acquiesced to PRC demands that we not sell the RoC these models—instead we agreed to sell markedly less capable A/B models).  Bloomberg reports our administration’s bigger talk, now: A jet sale

“warrants serious consideration given the growing military threat to Taiwan,” Robert Nabors, the White House’s director of legislative affairs, said in a letter [26 April] to Senator John Cornyn, a Texas Republican.

On top of this, the administration is working a deal to base a small number of American troops at a location on Australia’s northern coast.

So far, though, little Japan, with its constitutionally mandated limits on its military posture, seems to be taking the more aggressive action.  As The Wall Street Journal reports,

“Japan will promote…enhancement of its defense posture in the area, including the Southwestern Islands, in coordination with the US strategy of focusing on the Asia-Pacific region,” [Prime Minister Yoshihiko] Noda told [the paper], referring to a chain of islands in the East China Sea over which China and Japan have clashed.

It’s also useful to note that the Southwestern Islands loosely bound the East China Sea, and they are part of a longer island chain that loosely connect Japan with the Republic of China.

The WSJ cited Mr Noda further as describing

…a number of concrete measures that would spread Japan’s military presence throughout the region.

The two nation will develop the American-controlled Pacific island of Guam as “a strategic hub” and consider building joint training facilities there and on nearby islands—a move that would establish for the first time a permanent Japanese military presence on US territory.  Mr Noda said one possible location would be the Northern Mariana Islands.

We’ll see in time whether our own moves are just more of a piece with President Obama’s foreign policy technique—idle chit-chat—or whether it’s serious.  Still, it’s a promising beginning.  In an election season.

Mind Sets

One of President Obama’s jokes at the recent Correspondents’ Dinner was along the lines of

I want to thank all the members [of Congress] who took a break from their exhausting schedule of not passing any laws to be here tonight.

So, says the Progressive-in-Chief, Government’s role is to pass more laws, to be more intrusive and controlling.

Others have an alternative mind set.

[A] part-time Congress.  Cut their pay in half, cut their time in Washington in half, cut their staff in half, send them home.  Let them get a job like everybody else back home has.

Then they could have a productively busy schedule.

Government Pensions

Steve Malanga, in a Wall Street Journal op-ed, had some rather dismal things to say about the health care and pension obligations of various state and local governments.

Citing Chicago Mayor Rahm Emanuel, he wrote

Unless Illinois enacts reform quickly, [Emanuel] said, the costs of [pension and retiree health-care] programs will force taxes so high that, “You won’t recruit a business, you won’t recruit a family to live here.”

Indeed,

Early last year, [Illinois] imposed $7 billion in new taxes on residents and business, pledging to use the money to eliminate its deficit and pay down a backlog of unpaid bills (to Medicaid providers, state vendors, and delayed tax refunds to businesses).  But more than a year later, the state is in worse fiscal shape, with its total deficit expected to increase to $5 billion from $4.6 billion….

The result?  For one, Caterpillar, which makes heavy construction machinery, decided last February to build its next plant in Not-Illinois.

But Illinois isn’t alone.  California is acting just as…suboptimally.  In Oakland, property taxes are still being collected, to the tune of an additional $410 per year beyond “ordinary” property taxes, to pay off a municipal pension fund that went bankrupt over a generation ago—in 1976.  So is Massachusetts going broke.  The Massachusetts taxpayers Foundation found that, for 10 cities in the state, the average per person debt for unfunded retiree health-care government obligations was more than $13,500.

There is, though, no competition among the states for getting businesses to locate in them.  It’s a no brainer, as the difference between the neighbors, Illinois and Indiana, illustrate.  Indiana’s per capita debt for unfunded retiree health-care benefits is $81. For Illinois, it’s $3,399.

Hmm….

Some Thoughts on Student Debt

Having railed about Federal government debt for a bit, I got interested in student debt—an other end of the scale.  Specifically, I got curious about who borrowed, by chosen major field, and what the outcomes might be of those borrowings, based on salaries for jobs in those fields.  Much of the data in this post come from Steven A Harrast’s paper, Undergraduate Borrowing: A Study of Debtor Students and Their Ability to Retire Undergraduate Loans, which can be found here.  The data in this paper are from 2003-2004, so they predate the current economic dislocation, but the principles, I think, are intact.  The paper has a lot of good information in it; RTWT.

Using a student loan calculator, we can see some expected first year salaries and “affordable debt” suggestions for a number of majors.  I’ve selected four to be used illustratively throughout this post, and I used the calculator’s default values otherwise.

Major

Starting Salary

Maximum Manageable Debt Load

Sociology

$35,300

$35,976

Education

$35,900

$36,587

Engineering

$56,600

$57,683

Mathematics

$50,000

$50,957

These outcomes hold generally: the maximum manageable debt load is roughly the first year’s salary.  More than that is “excessive borrowing;” although this is a squishy limit.  Harrast defined excessive borrowing as “the difference between debt at graduation and lender-recommended debt level,” where the latter is based on an ability to pay 8% of a graduate’s second-year salary.  Others consider excessive debt to be total debt (which would include credit card, mortgage, if any, and the like, in addition to student loan debt) greater than 37% of income, which would lead most lending institutions to decline to lend.  All three definitions lead to substantially the same amount of “excess” for the purposes of this post.

Also, it’s clear that STEM-type majors (Science, Technology, Engineering, Mathematics) pay more, and so can borrow more, than do non-STEM majors.

Who incurs excessive student debt?  According to Mark Kantrowitz, of FinAid.org, that breakout looks like this for our example majors.

Major

Per Cent Overborrowing

Sociology

5.7%

Education

4.3%

Engineering

3.5%

Mathematics

3.6%

STEM students do better at managing their greater debts.  And importantly so: the overall average per cent of students excessively borrowing, across all majors, was 4.1%.

It’s also useful to lower the bar a bit and look at the size of excessive debt, given that it exists.  One way of looking at this is to look at the 75th percentile borrowing.

Major

Student Loan Debt at Graduation

Excess Student Loan Debt at Graduation

Sociology

$30,888

$11,795

Education*

$26,944

$7,850

Engineering**

$22,239

$3,146

Mathematics***

N/A

N/A

*Here, an average of Consumer Science and Education and Special Education
**Here, an average of Electrical and Mechanical Engineering
***Data were not provided by Harrast.

Plainly, some jobs are more valuable than others.  More importantly, the rigor associated with learning those jobs seems to correlate well with the ability of students to manage their debt buildup, and of the newly graduated to manage their accrued debt.

As some have asked,

Want to major in gender studies, women’s contemporary literary issues, or African-American history? Feel free, but don’t expect a dime from the US taxpayer. Because you likely won’t be able to pay your debt, and you most likely won’t be able to find a job to support yourself. Which means the degree is essentially worthless. And that is a luxury this country cannot afford any longer.