Defense and the Russians

The Russian government has shown their fundamental view of the United States and of their relationship with us.

Russian President Dmitry Medvedev said last year that Russia will retaliate militarily if it does not reach an agreement with the United States and NATO on our missile defense shield.

At a daylong Missile Defense Conference that took place in Moscow last week, the Russians made explicit their threat against us.  General Nikolai Makarov, the Russian armed forces chief of staff said, referring to missile defense installations currently contemplated by us in eastern Europe,

A decision to use destructive force pre-emptively will be taken if the situation worsens[.]

Makarov extended the scope of Russia’s intended actions.  He displayed on a large-screen video system for the benefit of conference delegates from 50 countries, including the US and NATO, computer-generated imagery depicting the reach of the American radar and missile systems that are components of our missile defense shield.  Russian missiles were shown streaking toward the US before being intercepted.

But this overt aggressiveness is not a new position for the Russians.  They threatened nuclear attacks against Poland four years ago if we deployed components of a then current missile defense shield there and in the Czech Republic.  We quietly canceled those plans.  The Russians invaded Georgia over a manufactured pique and perpetrated a Sudetenland-like partition of that country while we stood meekly by.

A couple of questions arise.

Why would Russia be thinking about a nuclear attack against the US?

Why would Russia casually threaten us in front of the world?

Perhaps they sense timidity on the part of the US administration.  Certainly, in the face of these public threats against both our allies and our homeland, our own State Department Special Envoy for Strategic Stability and Missile Defense, Ellen Tauscher could only say that it was

pretty clear that this is a year in which we’re probably not going to achieve any sort of a breakthrough.

But this was the point President Obama was making a couple of weeks ago to Medvedev when Obama pleaded for more time on the defense question—he’d have more flexibility to give the Russians what they want after he’s no longer accountable to the American people.

So much for Reset.  In the face of such naked threats of war—of preemptive war—how can the US do anything at all other than to press ahead with the deployment of a missile defense shield, now including defense against the long-range ICBMs that Russia has shown with their little demonstration that they fully intend to use against us?  On what basis can the Obama administration seriously be talking about disarming us in the face of these overt threats?
Unemployment and Unemployment

Last Friday, the Bureau of Labor Statistics jobs data were released.  Superficially, they seem encouraging—the unemployment rate dropped a tenth of a point to 8.1%, the lowest rate since the month of President Obama’s inauguration.  Moreover, nonfarm payroll employment rose by net 115,000 (130,000 new private sector jobs against a loss of 15,000 government sector jobs).  But the data behind these numbers are appalling.

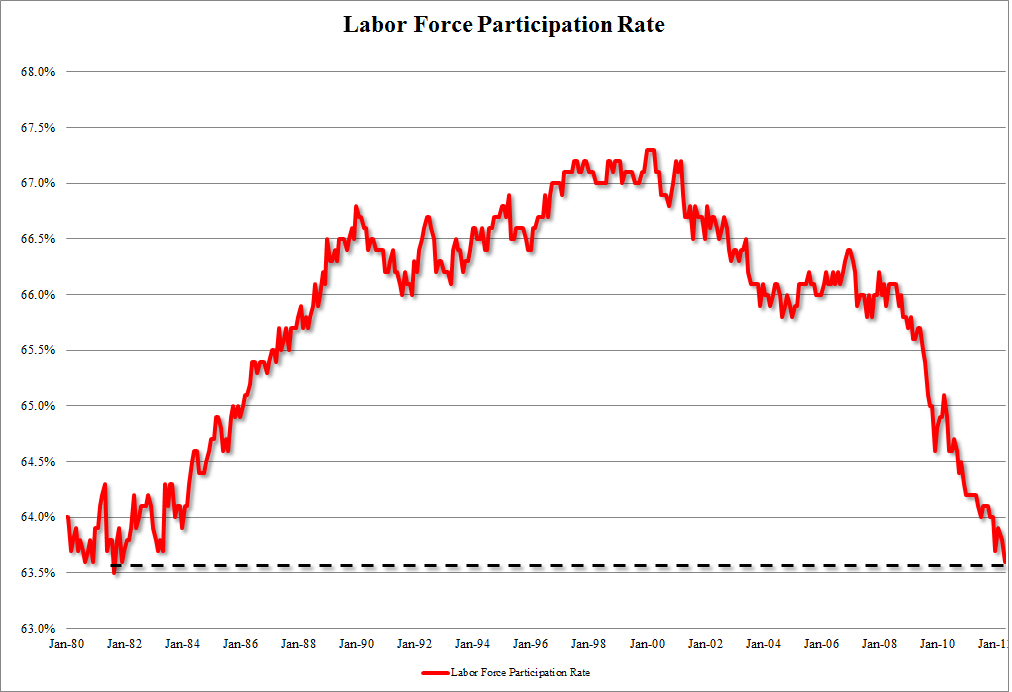
By April, the number of people not in the labor force at all had risen to nearly 88.5 million, the highest non-participation rate on record.  Indeed, this is a rise of over half a million (ex-) workers just since the March data release.  This has driven the labor force participation rate—the per centage of our population that hasn’t yet given up and are still actively working or looking for work, to 64.3%, a 30-year low.  Other estimates confirm this: 342,000 people dropped out of the labor force, while the ranks of the unemployed fell by just 173,000.

The Wall Street Journal also reported [emphasis added]

Friday’s report was weak across categories.  Manufacturing employment, an area of strength in recent months, grew by a disappointing 16,000 jobs.  Construction employment fell slightly.  Full-time employment plunged by more than 800,000 jobs.

That’s why that headline unemployment rate dropped.  The unemployment ratio is a fraction consisting of the number of people out of work divided by the number of people working or looking for work, and more people gave up and left the work force—became non-persons in the eyes of the Government’s jobs bean counters—than found jobs.  The number of people left who are working or looking for work shrank precipitously.

A couple of pictures illustrate the story.  (The graphs might be a little hard to read.  The Labor Force Participation Rate graph is in two-year increments from January 1980, and the Persons Not In Labor Force is in three-month increments from December 2007.)

The number of folks wanting to work, that labor force participation rate, rose rapidly in the optimism of the Reagan economic boom into the dot-com bubble.  When the bubble burst, participation rate fell off, but was recovering during Bush the Younger’s second term (when his own tax cuts were starting to take effect) until the Barney Frank housing bubble burst.  And during the Obama administration, the participation rate has fallen off a cliff, as more and more Americans give up due to the current administration’s policy failures and stop looking altogether for work.

Beginning with that housing bubble starting its failure, the population no longer in the work force began running up more steeply, and it’s continued without break throughout the present administration’s set of “economic” policies.


h/t GayPatriot

Some Thoughts on Free Markets and Limits

I was driving to the airport to pick someone up after a too-long absence the other day when the traffic load struck me (figuratively).  I was driving on a modern freeway with no impediments to traffic flow.  Adjacent to this was a frontage road with traffic lights.  Even though the traffic loads were the same on both roads, the traffic on the frontage road stayed bunched up and slow moving—neither the drivers who wanted to go faster nor the slower drivers were able to go as fast as they wished due to the limits imposed on everyone traffic by those lights.

On the freeway, however, the traffic quickly got strung out and widely spaced, as the faster drivers moved apace, and the slower drivers—moving faster than their brethren on the frontage road—moved at their preferred slower pace.

What has this to do with free markets, one might ask.  It’s those limits.  The traffic lights—the limits a government applies to a centrally managed economy that requires (limited) licenses to manufacture so as to not over produce, licenses to sell so as to avoid unsanctioned pricing, licenses to handle the manufacturing scraps, donations to the correct political cause, and “protection” for everyone—keep everyone bunched up and slow-moving.  Certainly, the speed range between the fast-movers and the slow-movers was much narrower than the speed range on the freeway, but everyone was moving much more slowly than we were on our freeway.

Of course, on closer inspection, the analogy breaks down, but that closer inspection, now that we have the overall picture from the analogy, demonstrates the power of the free market economy compared to one that’s controlled by government, one that has those “traffic lights.”  Within the context of this post, the individual actors on each of the two highways are largely unrelated to each other, with the cars on the traffic light-limited highway, for instance, connected only by the physical presence of a car in front that’s held up by a red light or that is a slower-moving car in the forced bunch and so is holding up all the cars behind it.

In a free market economy, though, all the players are inextricably intertwined.  Indeed, the fast-movers don’t merely facilitate the slow-movers’ ability to get along down the market road, these fast-movers actually help pull the slow-movers along—even though the speed range between economic fast-movers and slow-movers in the free market is wider than it is in the managed economy.

Take luxuries, for example.  Two come to mind: air conditioners and televisions.

Oh, wait; these aren’t luxuries anymore, and they haven’t been for decades.

When these things first came out, only the rich, the economic fast-mover, could afford an air conditioner in the window of his house or a TV in his house’s living room.  But in a free market, these fast-movers helped create the market for the air conditioner and the television.  Call it a status symbol—I’ve arrived—or a desire to be first on the block to have one, or any other reason, only the rich both could afford such things and were interested in acting on the desire.

Air conditioner and television producers, wanting to sell more into that nascent market, produced more, and so more were bought.  In the free market economy, others wanted a piece of that action, and they produced air conditioners and televisions.  Competition between the producers—which doesn’t exist in a managed economy—began driving prices down, which made these luxuries more affordable—which drew in more producers wanting a taste of the money, which drove prices down even more, and ultimately, nearly everyone could—and did—buy.  Today, most houses have central air, and of those that don’t, most have window air conditioners that cost as little as $100—an unheard of level of cheapness 50 years ago—and air conditioning comes standard in our cars.

Today, most houses have multiple televisions, and increasing numbers have 50″ and 60″ plasma or LCD televisions, technologies not even imagined in the ’50s when television sets first started to become widely affordable.  And our higher end (no longer strictly high end, even) cars now have DVD players, or streaming video, or both—again, technologies unheard of just a bit ago.

Moreover, it’s those fast-movers that do the hiring of those slow-movers, either directly into their own production facilities, or indirectly, by the market’s push to get more manufacturing online, into other production facilities that are newly built or expanding existing operations to support the burgeoning market for all those (ex-) luxury goods. The ripples spread, too.  Supporting functions grow: the transistor and chip manufacturers to support the circuits in all those televisions, for example.

All this because the economic fast-movers wanted a luxury good, and a free market, unlimited by government “guidance,” enabled those luxuries to become commodities.

Finally, one too-often overlooked result is that those relatively farther behind free market slow-movers are vastly better off than are their slow-moving counterparts in the managed economy.  And with the jobs created by that free market, they have excellent opportunities to move up their economic ladder.

Where in the World is Osama bin Laden?

Jose A. Rodriguez, Jr, a 31-year veteran of the CIA and the author of Hard Measures: How Aggressive CIA Actions After 9/11 Saved American Lives, has some thoughts on our ability to answer this question a year ago.

This administration built on work pain­stakingly pursued for many years before Obama was elected—and without this work, Obama administration officials never would have been in a position to authorize the strike…that resulted in bin Laden’s overdue death.

Some of that work consisted of things President Obama considered more unsavory than assassination.

In 2004, an al-Qaeda terrorist was captured trying to communicate with Abu Musab al-Zarqawi…. That captured terrorist was taken to a secret CIA prison—or “black site….”  After being subjected to some “enhanced interrogation techniques”—techniques authorized by officials at the most senior levels of the US government—the detainee became compliant.  …he told us many things—including that bin Laden…depended solely on a single courier who went by “Abu Ahmed al-Kuwaiti.”

Culminating, ultimately, in this:

…the CIA was able to discover the true name of the courier.  Armed with that information, the agency worked relentlessly to locate that man.  Finding him eventually led to tracking down and killing bin Laden.

In sum,

…the trail to bin Laden started in a CIA black site—all of which Obama ordered closed, forever, on the second full day of his administration—and stemmed from information obtained from hardened terrorists who agreed to tell us some (but not all) of what they knew after undergoing harsh but legal interrogation methods. Obama banned those methods on Jan. 22, 2009.

Because Obama Knows Better.

Others also have objected to Obama’s arrogance.

Subsidies and Costs

Much is made of the need for subsidies for things that are too expensive for people/businesses to get into on their own—college and solar energy for example.  After all, if folks want into these enterprises, they’re at all useful, but folks can’t afford to get involved, a taste from government to help them out is good, right?  I’ll leave aside the question of whether such an endeavor actually is useful; it’s not relevant to whether subsidies are beneficial.

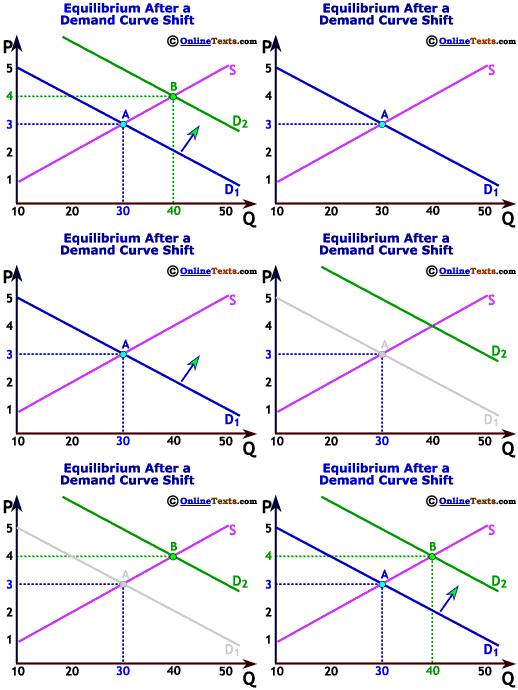
The figure below, which comes from OnlineTexts shows in stark terms the effect of a subsidy.  The P and Q (which we always should mind) on the graph’s axes are economist-speak for Price and Quantity.  The line labeled S is a supply line, which simply shows generically how the price of a thing varies with its supply: as the price increases, producers will produce more (no, it does not indicate that as producers make more, the price they can get goes up).  The two lines labeled D1 and D2 show before and after conditions of how price varies with demand for that same thing: for each line, as price goes down, more people want that thing.  The points labeled A and B simply show hypothetical equilibrium price and quantity for the two demand conditions—the price at which, in theory, everyone gets to buy that thing, and no one is left out; and after all that buying and producing, no single example of that thing is left over, every one produced has been bought.  Each D line represents a different population interested in buying that thing.

It’s useful to note that supply lines can shift, also; however, in most cases demand can change faster than supply so that supply will change after and in response to that demand shift.  The change from D1 to D2 occurs today; S will not shift until tomorrow—it takes time to add factories, hire and train workers, and so on.  S will, tomorrow, shift either to the right or to the left, depending on the producers’ actual reaction to the demand shift.

So what does this graph tell us about the effect of subsidies on the cost to all of us of the subsidized thing?  The folks on the D1 demand line represent the folks that can afford to buy the good today—pay for college, build an electricity generating station that uses solar energy exclusively, buy that solar energy-produced electricity for their homes, and so on.

The price for these on D1—Point A—is deemed by government to be too high; more folks “should” be buying these goods.  Government wants to help, so it offers a subsidy for the good.

It doesn’t matter what form that subsidy takes, whether it’s a direct payment to the buyer for the purpose of a specific purchase, a tax deduction—or credit, an even larger subsidy—after the fact for having made that purchase, a payment to the producer/seller for offering the thing at a “reduced” price for certain buyers, etc.  As a result of the subsidy, the population of folks who are interested in buying that thing changes—it expands—and the demand line shifts to the right: D1 moves to D2.  Everyone is happy, right?  But what happened to the price?  It went up: the equilibrium price now is at Point B.  Despite a larger quantity of the thing being available with current production facilities, the price everyone—subsidized and not subsidized—now is paying increased.  After the subsidy was provided, everyone began paying a higher price than anyone was before the subsidy was provided.  There’s more money available with which to buy that thing, so the sellers/producers are able to charge more.

Sure, the subsidized person is paying a relatively reduced price out of pocket, but to the extent he pays taxes—now or in the future—he’s paying a higher price when those taxes are added back in.  And those taxes are inevitable: either they’re current taxes to pay for the current subsidy, or they’re future taxes to pay for the current borrowing that provides the subsidy.  But the unsubsidized person also now is paying a higher price, both out of pocket and through those taxes.

This isn’t theoretical.  As Eric Falkenstein notes on his blog,

Federal college aid has risen 165% over the past decade, and college and college costs have risen about 74% over that same period.

Moreover, as recently as FY2007 (pre-Obama explosions) Federal subsidies for solar-generated electricity amounted to $24.34 per megawatt-hour and $23.37 per megawatt-hour for wind, compared with $0.44 for conventional coal and $0.25 for natural gas and oil.  In fiscal year 2010, the subsidies were  $775.64 for solar power and $56.29 for wind, but for coal, natural gas, and oil were still only $0.64.  Higher subsidies have exploded the total cost of solar and wind energy.