
Some Thoughts on Freedom and Income

I guess today is my day for pretending to think.

Progressives have been trying to score political points by bellyaching about income inequality and pretending there’s something to this.  A couple of graphs from the Fraser Institute’s Free the World project bear on this.  The graphs below, in particular, are from their report for the year 2008; their latest report, dated 2011, covers the year 2009, and it’s not materially different vis-à-vis the poor.  Emphasis added, and kindly excuse the poor formatting.

The Institute’s reports also rank the world’s nations along various dimensions of economic freedom; there is a significant degradation in our freedoms and rankings between 2008 and 2009, as I’ll mention at the end.

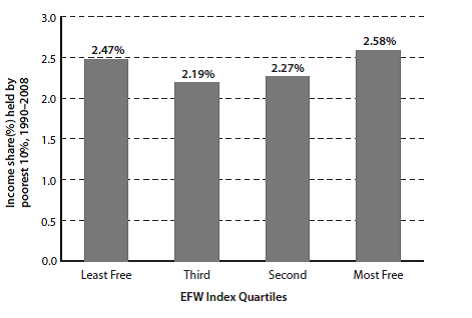
Exhibit 1.8: Economic Freedom and the Income Share of the Poorest 10%

The share of income earned by the poorest 10% of the population is unrelated to economic freedom.

Sources: Fraser Institute, Economic

Freedom of the World: 2010 Annual Report;

World Bank, World Development Indicators.
Now let’s look at another aspect of the poor’s situation.

Exhibit 1.9: Economic Freedom and the Income Level of the Poorest 10%

The amount, as opposed to the share, of income earned by the poorest 10% of the population is much higher in countries with greater economic freedom.

Sources: Fraser Institute, Economic

Freedom of the World: 2010 Annual Report;

World Bank, World Development Indicators.
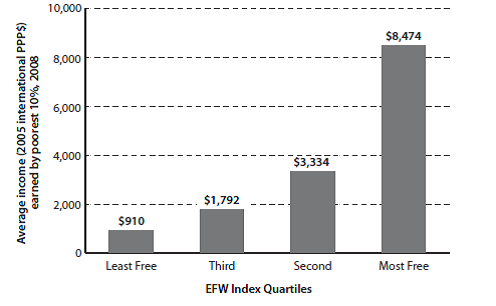
This is dramatic.  While the poor’s share of the wealth is independent of the degree of freedom in the country in which they live, their wealth in absolute terms is enormously greater, and it gets more so as the degree of freedom increases.  The poor of a free nation are far better off than the poor of a tyranny.  Of course this is not reason to disregard the relative plight of the poor in any nation.  Certainly, after (and only after) private and local community aid efforts for the needy (who are, in fact, only a subset of the poor) have been exhausted, an argument exists for aid at the state level (now speaking for the United States alone), to be followed—only as a last resort—by  Federal assistance to state-tailored and -run work-for-assistance programs for the few remaining that need assistance.

One more thing: where the US sits on the freedom scale is instructive.

The following small table is excerpted from Exhibit 1.5 from the same report as the graphs above.  The year is the year for which the rating is valid; the ratings themselves are on a scale from 1-10, with 10 being most free.  For context, the US is rated as 6th most free in the world, overall, with Hong Kong the freest and Chile ranked number 5.

Year        1970  1975  1980  1985  1990  1995    2000    2001    2002   2003   2004  2005  2006  2007  2008

US          7.74    7.83    8.03    8.18   8.43   8.32    8.45     8.23     8.22    8.17     8.15   8.07    8.01    8.08   7.93

Hong Kong 8.99   8.85   9.21   8.81   8.76   9.11    8.82     8.76     8.76    8.81     8.75   8.94    8.95    9.00   9.02

Chile      4.31   3.93    5.56    6.18    7.02   7.47    7.28     7.47     7.59    7.75     7.67   7.94    7.97    8.08   7.99

Notice the freedom trend for the US.  We were at our freest in 2000, then the Federal government began increasing the degree of regulation it forced onto our economy—both business and individual.  Yes, the Progressive rap on the Bush years is that he deregulated, and did too much of it.  But on this, as with so many things, the Progressives are wrong.  By 2008, the US only ranked 26th in our freedom to trade internationally and our business regulatory controls.  Appallingly, our credit market regulatory regime ranked only 103rd.  (As an aside, despite Congressman Ron Paul’s concern about the soundness of our money, as of 2008, we ranked number 2, with Japan at number 1.  Of course a lot has changed since 2008: in 2009, our rank fell to 11.)

And the degree of regulatory control has exploded under the Obama administration.  This has driven our ranking in overall regulatory freedom from 17th in 2008 down to 27th just in Obama’s first year, 2009 (we were 2nd in 2000).  Associated with this, the per centage of Americans living below the Federal poverty level has grown to historic highs these last three years.

Some Thoughts on a New Hampshire Exit Poll

A Fox News Exit Poll has some interesting tidbits from the just concluded New Hampshire Republican primary.  It’s important to note that in New Hampshire, Independents can vote in the Republican (or Democrat) primary, unlike the Iowa caucuses, where caucusers(?) must register in one party or the other (albeit they can register on the spot).  Finally, my summaries below talk about pluralities of the vote, rather than absolute majorities, unless I explicitly indicate otherwise.

The nearly final votes (Fox News was reporting with 95% of the precincts calling in their numbers) notwithstanding, the race was essentially between Romney and Paul, with Huntsman a strong afterthought and the others just getting in the way.  This is clearest with the age breakout exit polling: as the voters got older, they went more strongly for Romney; their only other serious candidate was Paul—who lost his edge somewhere in the voters’ mid-30s.  The other candidates just siphoned votes from these two.

The more educated the voters, the more strongly they went for Romney over Paul, although the split was, at all education levels, strongly pro-Romney.  Income level outcomes roughly mirrored the education level results; however, this is expectable, as education level strongly influences income level, especially as voters age into their careers.

On more politically oriented characteristics, the results get interesting.

Self-identified Democrats went for Paul  (the cynic in me sees two possible reasons; take them with a shaker of salt: the Democratic Party tried to influence the Republican primary, and/or Paul’s foreign policy is even more strongly Democratic than President Obama’s), while self-identified Independents split roughly evenly between Paul and Romney, with a slight edge for Paul.  On a self-identified Liberal-Conservative spectrum, the more conservative the voters, the more strongly they went to Romney, but Paul never had a significant advantage on the Liberal end: these split roughly evenly between Paul and Romney.  (Compare this with the self-identified party affiliation outcome….)

There aren’t any self-identified liberal tax and spenders in this state; the farthest Left they go is “moderate.”  And these all went strongly for Romney.  Interestingly, moderates and moderate conservatives slightly favored Huntsman over Paul.

On the social issue (gay marriage and abortion) Liberal-Conservative spectrum, only the most Liberal went to Paul; although Huntsman got a significant per centage of their votes.  The Somewhat Liberals favored Huntsman over Paul, and this group also liked Huntsman nearly as much as Romney (slightly more than one-third went to Romney, slightly less than one-third to Huntsman).  All the rest of the spectrum—Moderates to Strongly Conservative—went strongly for Romney.

Those strongly opposing the Tea Party strongly favored Huntsman.  Everyone else on the Tea Party Oppose-Favor spectrum went to Romney; although the somewhat opposers split their votes between Romney and…Huntsman (slight edge to Romney).

The single-issue voters were the only ones where Santorum had a good showing: where abortion was key, Santorum received a very strong plurality.  On the budget deficit, the voters were split between Romney and Paul, and on the economy, they strongly favored Romney.  Health care wasn’t a factor.

The single-candidate-quality voters who considered beating Obama the be-all and end-all went for Romney with a strong absolute majority—62%.  Where being a true conservative was most important, they went to Paul with a strong plurality, and Romney, Gingrich, and Santorum essentially split the rest (slight edge to Santorum among these three).  Where having a strong moral character was the thing, the voters again gave a sharp plurality to Paul, this time with the rest split among Romney, Santorum, and Huntsman.  The right experience voters split between Romney and Huntsman.

Among those feeling dissatisfied with the Obama administration, or outright angry with it (not many were as favorable toward it as “satisfied, but not enthusiastic”), most went to Romney; among the outright angry, Paul and Santorum split those who didn’t vote for Romney.  Among those somewhat to very worried about the future of our economy, the voters again went to Romney; although among the moderately worried, the rest of the voters essentially split between Paul and Huntsman.

The voters themselves were split between whether their elected officials should compromise to get things done or stick to their principles.  Both groups, though, favored Romney.  The compromisers also liked Huntsman, and the principles first-ers like Paul nearly as much as Romney.

The series of questions concerning voter satisfaction if this or that candidate won the nomination was interesting.  Nearly two-thirds of the voters would be dissatisfied if Gingrich were to win, three-fifths would be if Santorum were to be nominated, and over half would be if Paul were to be nominated.  On the other hand, three-fifths would be satisfied were Romney to be nominated.

The long series of debates paid off in New Hampshire: 80% of the voters considered them somewhat to very important to their voting decision, while over half the voters didn’t give a hoot about campaign advertising.  However, nearly a third gave some weight to the ads.

Oddly, unmarried voters broke more strongly for Paul than did their married counterparts, handing Paul a strong plurality in this demographic.

This is a strongly conservative state; they went strongly for Romney; and the more strongly they felt about anything, the more strongly they went for Romney, with some isolated exceptions.  They also liked the Libertarian Paul and the RINO Huntsman, but the self-proclaimed “true conservative” candidates the state essentially told to take a hike.