
These data are from USAFacts, and they’re at the county level, since that’s the maximum data fineness that the Centers for Disease Control and Prevention, USAFacts‘ source, publishes.
The top 10 homicide rates—homicides per 100,000 population—were in these counties as of 2023 (the latest data available from CDC):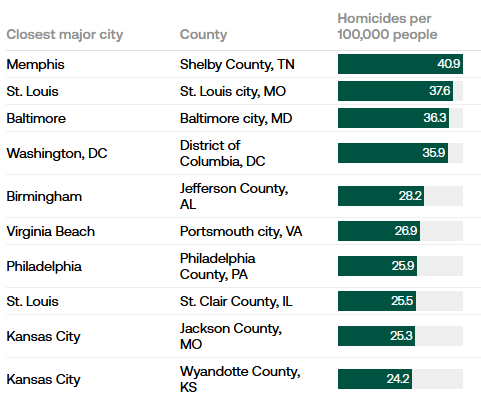
The closest major city is for context; the rates are for the indicated county.
Every single one of these counties is run by Progressive-Democratic Party politicians.
The 10 counties with the largest increase in homicide rates, 2023 over 2018, are these: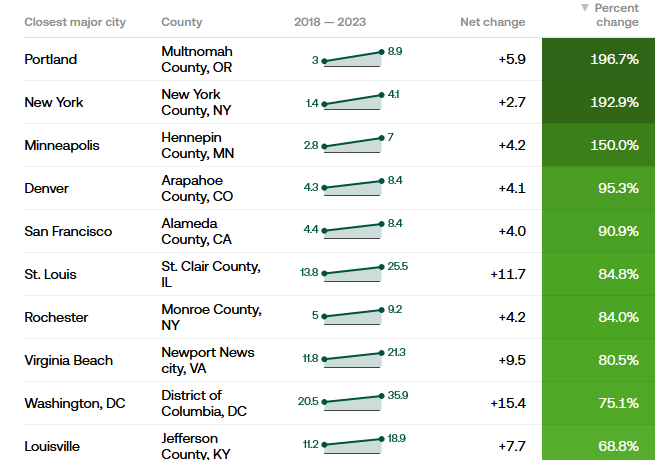
Again, the closest major city is for context; the rates are for the indicated county. All of these counties are Party run, also. Given the overlap between high rates and rising rates, it shouldn’t be surprising that at least most of these are Party run.
One item of note here, while acknowledging that these data are a year and a half-ish old, is DC. That county had the third highest homicide rate and the ninth highest rate of increase in its homicide rate. It seems true that DC’s homicide rate is lower today than in 2023, but it’s still among the highest in the nation.
No less a light than PBS cited a Rochester Institute of Technology report that indicated that DC’s homicide rate per 100,000 had fallen in 2024 to 27.3. What those “fact checkers” chose to ignore was that even in the RIT report, DC’s rate was the fourth highest of the 24 cities that RIT looked at, and it’s still higher than that 2018 starting figure by 33%. That last, though, is my calculation from comparing RIT‘s 2024 value with the starting value in the second figure above. The RIT report did not look at rates of increase of homicide rates.
Yet this is the poor performance of DC’s governance that Party is so desperate to defend as they zealously oppose President Donald Trump’s (R) concerted effort to clean the place up.