I’ve written a few times (the latest here) about the results of Federal government shutdowns. Progressive-Democratic Party politicians always and everywhere are in full-throated panic-mongering about the disaster that is a shutdown. Far too many Republican Party politicians timidly accept the Leftist Party’s claims and seek to do anything, even on bended knee, to avoid a shutdown.
I have a challenge for them, and for all you out there in reader land.
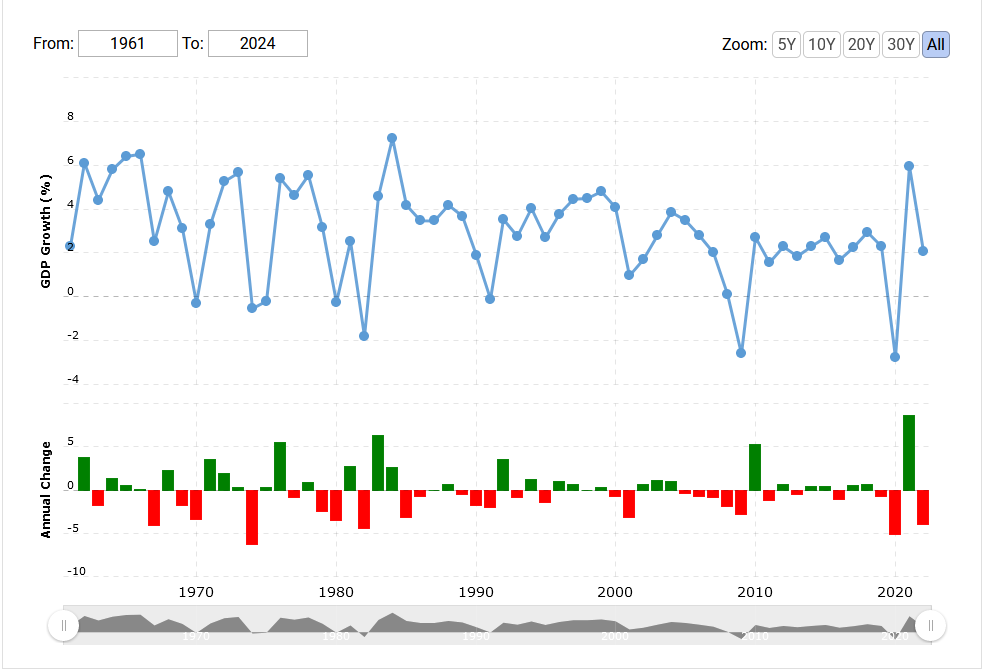
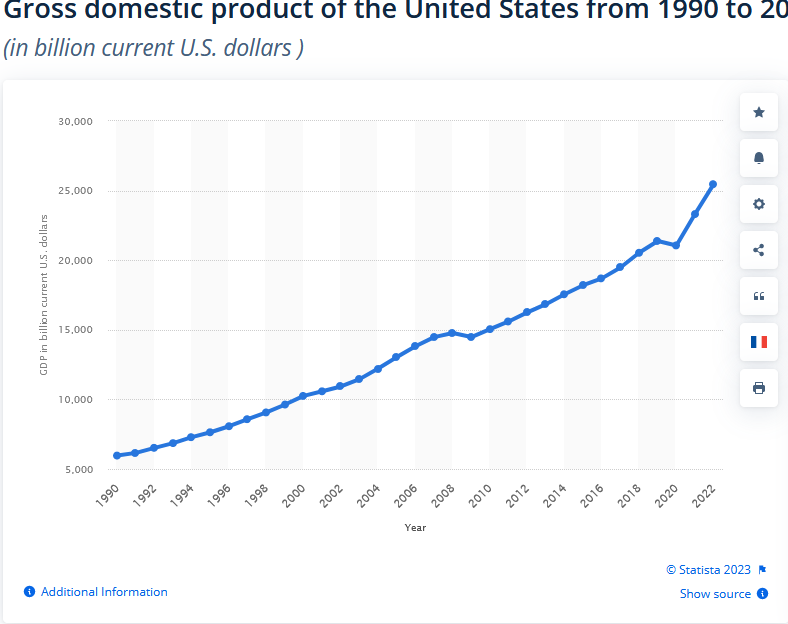
Here are two graphs, the first from Macrotrends showing our GDP growth rate from year to year from 1961 through 2022, and the second from stastica showing GDP levels over the more focused period of 1990-2022.
 My challenge is this: find, in either graph, the Federal government shutdowns of 2013, 2018, and 2018-2019.
As an aside, as I write this late Saturday, the House passed a 45-day, keep the government open, funding bill; the Senate then passed the House bill and forwarded the thing to President Joe Biden (D). The bill omitted any spending cuts, steep or otherwise, and dropped any aid for Ukraine.
This, in light of the above, represents a surrender to the Progressive-Democrats forced by the allegedly Republican Chaos Caucus led by Zoo Master Matt Gaetz (R, FL), who have offered nothing beyond “No” to any bill on offer, including the prior Republican-led House stop-gap bill that included significant cuts to spending—which would have given time to work out the remaining appropriations bills with even deeper and broader spending cuts. Gaetz might as well have joined Progressive-Democrat Congressman Jamaal Bowman in deliberately pulling a Congressional office fire alarm in an attempt to stall any House action at all.
