
These two are excerpted from Phil Kerpen’s, Stephen Moore’s, and Casey Mulligan’s A FINAL REPORT CARD ON THE STATES’ RESPONSE TO COVID-19, a working paper published through the National Bureau of Economic Research. The first table identifies the 10 States that performed best during the height of the Wuhan Virus situation, as assessed across three variables: the economy, normalized by State industry composition; education, as measured by lost school days; and mortality, normalized by State population age and the prevalence of obesity and diabetes (leading co-morbidities for Covid deaths).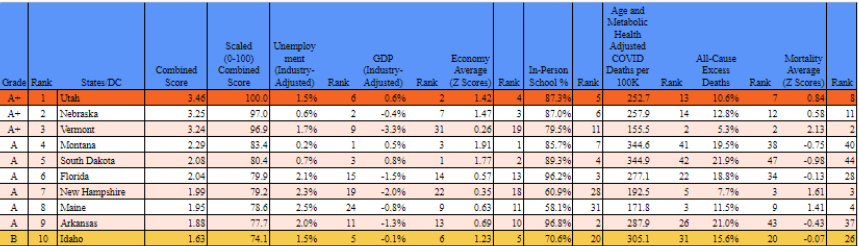
The second table identifies the 10 States that did worst.
States that opened from lockdowns early in the virus situation did better overall and on education and economic measures, and those same States did as well as (Florida vs California, for instance) or better on health outcomes related to lockdowns.
Oddly, those States that did best are Republican-led, and those States that did worst are Progressive-Democrat-led.
Go figure.
Note: right-click on the tables and select Open Link in a New Tab to get a bigger image.