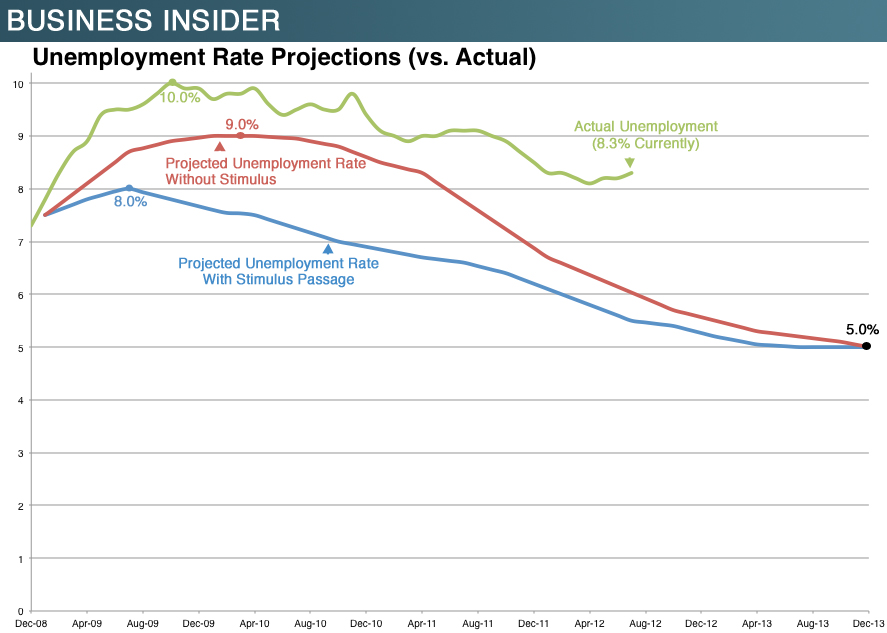
As if there’s any more need to demonstrate the fallacy of Keynesian stimulus pseudo-theory after its failure in the ’30s, some empirical evidence from today’s economic dislocation and failed “recovery” is neatly summarized in the following graph from Business Insider: 
Most are already familiar with those projection curves, from the 2009 hype associated with ramming the American Recovery and Reinvestment Act of 2009 (the Stimulus Act) through the Democratic and then-economically timorous Congress. Government standing aside and letting the economy recover on its own was going to let unemployment peak at around 9% and not move below 7% until Dec 2011 or reach “full” employment until Dec 2013. On the other hand, the Obama Stimulus would cause an almost immediate peak (in August 2009 after a February enactment) at 8% and lead to recovery below 7% unemployment by fall 2010, a year sooner than under non-interference.
Instead, the Obama Stimulus has actively suppressed employment—and so economic recovery. Unemployment, at roughly 8.5% at the time of stimulus enactment, continued rising unabated to above 10%, and it has remained above the worse-case no-government projection ever since. Notice further, that actual unemployment has generally followed the shape of the no-government projection curve: the only effect of Obamanomics in this milieu has been to make government involvement worse than no involvement—it hasn’t altered anything else.
Do we have empirical data for the contrary position, that government noninvolvement is actively beneficial? You betcha. The Depression of 1920-1921 ran from the start of 1920 through the middle of 1921, and President Warren G Harding’s administration sat it out, with no significant government intervention attempted. The graph below is constructed from data taken from Table 9 in a paper by none other than Christina Romer.
There are a couple of takeaways here. One is the sharp, high peak to unemployment and the rapidity with which both the peak and the recovery occurred. Another is the rapidity with which our economy actually worked its way through this Depression compared to the projected recovery rates in the first graph above. The projections for our current failing recovery are, compared to hard data, cynically pessimistic. This pessimism, though, cannot be laid at Democratic Presidential Candidate Obama’s feet; a broad range of economists assumed that slow pace.
In general, to repeat earlier posts and statements made by others: money spent by government is money not available to the private sector or to individuals to spend on their own goals and needs. Money spent by the government is money that first must be taken from those private enterprises and citizens in the form of taxes today to pay for that spending or greater taxes tomorrow to pay both for that spending and for the interest on the debt incurred by that spending. And here we’ve seen empirical evidence that government spending, above a minimal level for funding government itself and national defense, isn’t just useless, it’s actively counterproductive—destructive.
