Last Friday, the Bureau of Labor Statistics jobs data were released. Superficially, they seem encouraging—the unemployment rate dropped a tenth of a point to 8.1%, the lowest rate since the month of President Obama’s inauguration. Moreover, nonfarm payroll employment rose by net 115,000 (130,000 new private sector jobs against a loss of 15,000 government sector jobs). But the data behind these numbers are appalling.
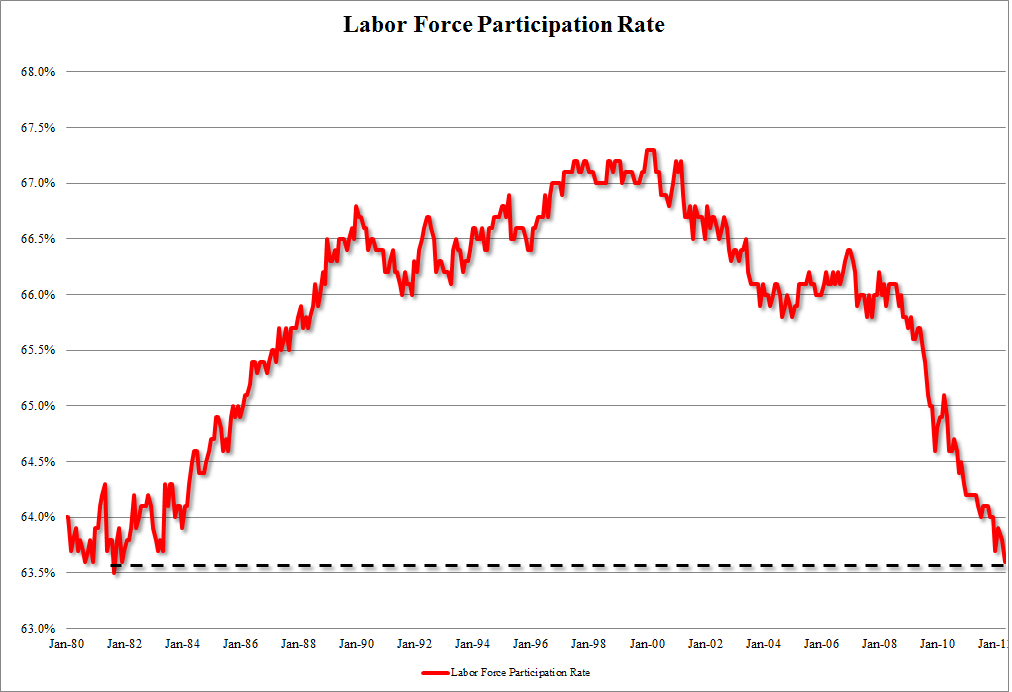
By April, the number of people not in the labor force at all had risen to nearly 88.5 million, the highest non-participation rate on record. Indeed, this is a rise of over half a million (ex-) workers just since the March data release. This has driven the labor force participation rate—the per centage of our population that hasn’t yet given up and are still actively working or looking for work, to 64.3%, a 30-year low. Other estimates confirm this: 342,000 people dropped out of the labor force, while the ranks of the unemployed fell by just 173,000.
The Wall Street Journal also reported [emphasis added]
Friday’s report was weak across categories. Manufacturing employment, an area of strength in recent months, grew by a disappointing 16,000 jobs. Construction employment fell slightly. Full-time employment plunged by more than 800,000 jobs.
That’s why that headline unemployment rate dropped. The unemployment ratio is a fraction consisting of the number of people out of work divided by the number of people working or looking for work, and more people gave up and left the work force—became non-persons in the eyes of the Government’s jobs bean counters—than found jobs. The number of people left who are working or looking for work shrank precipitously.
A couple of pictures illustrate the story. (The graphs might be a little hard to read. The Labor Force Participation Rate graph is in two-year increments from January 1980, and the Persons Not In Labor Force is in three-month increments from December 2007.)
The number of folks wanting to work, that labor force participation rate, rose rapidly in the optimism of the Reagan economic boom into the dot-com bubble. When the bubble burst, participation rate fell off, but was recovering during Bush the Younger’s second term (when his own tax cuts were starting to take effect) until the Barney Frank housing bubble burst. And during the Obama administration, the participation rate has fallen off a cliff, as more and more Americans give up due to the current administration’s policy failures and stop looking altogether for work.
Beginning with that housing bubble starting its failure, the population no longer in the work force began running up more steeply, and it’s continued without break throughout the present administration’s set of “economic” policies. 
h/t GayPatriot

