
From Watts Up With That, some data for the continental United States over the last 100 years, in graph form. Here’s the lead graph.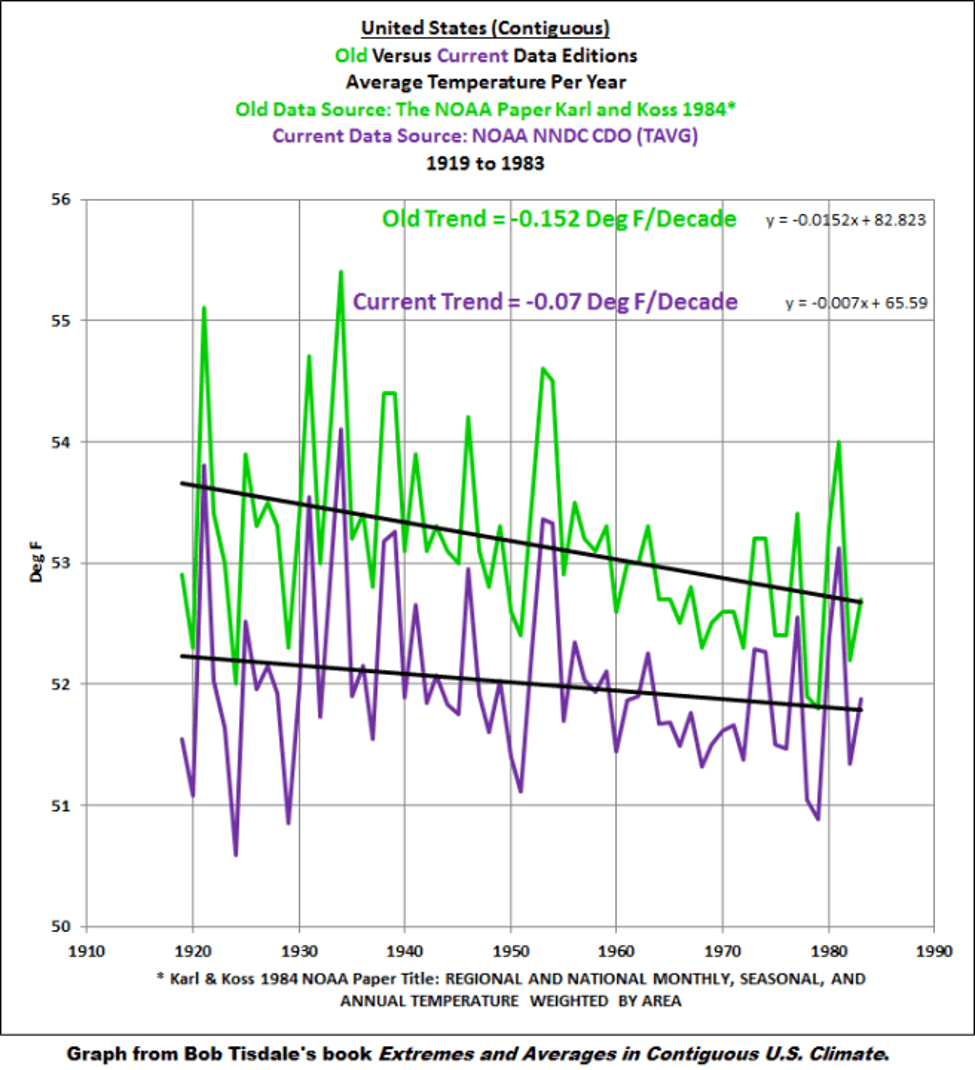
Cooling? Say, what? Notice the year-on-year variability, too. Sort of puts the “warming” since the mid- to late-80s in perspective.
Other data are similar in vein: precipitation data—flat; drought severity, when we have one—slightly rising.
RTWT