
…from the Tax Foundation, via AEIdeas. First this graph (right-click on it to get a bigger, more readable version):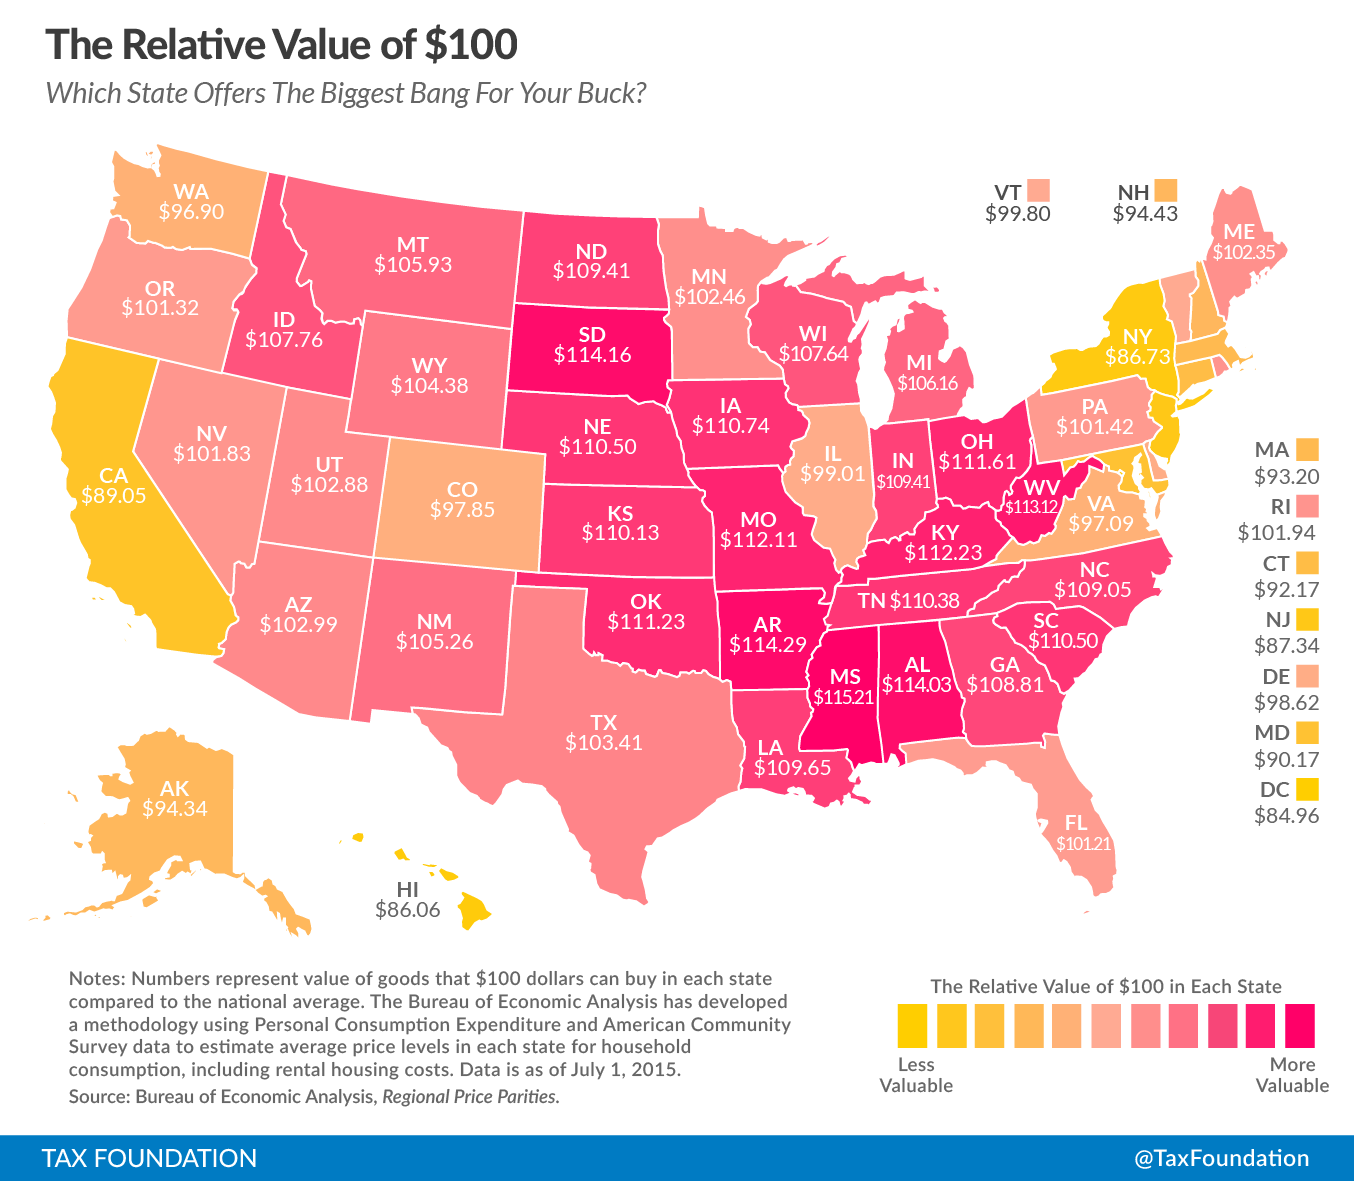
The figures are regional price parities of $100 for each of the 50 states, where the national average price is taken as 100. In other words, whereas on average across the whole country, $100 would buy $100 worth of goods, in California those $100 would buy only $89 and change, in Arkansas those $100 would buy a bit over $114 worth of the same goods. The bulk of the differences across the US was driven by relative housing costs: California’s housing, for instance, costs one-third more than the national average while Arkansas’ housing is one-third cheaper.
Mark Perry expanded on these data in his article at the AEIdeas link above, and adjusted per-capita personal income for differences in personal taxes and those price levels. California, based solely on income, ranked 12th in the nation at $48.5k per person. After adjusting for California’s tax bite and pricing, though, the value of a California’s average citizen fell to just $34.8k, dropping California to 37th in the nation the value of that nominal income.
Arkansas, on the other hand, started out 43rd in unadjusted income, with a citizen getting $36.7k. After tax and price level adjustment, though, the state rose to 31st, with that income becoming $35.5k.
There’s something to be said for cost of living and taxes in determining where actual prosperity resides.