Subsidies and Costs

Much is made of the need for subsidies for things that are too expensive for people/businesses to get into on their own—college and solar energy for example.  After all, if folks want into these enterprises, they’re at all useful, but folks can’t afford to get involved, a taste from government to help them out is good, right?  I’ll leave aside the question of whether such an endeavor actually is useful; it’s not relevant to whether subsidies are beneficial.

The figure below, which comes from OnlineTexts shows in stark terms the effect of a subsidy.  The P and Q (which we always should mind) on the graph’s axes are economist-speak for Price and Quantity.  The line labeled S is a supply line, which simply shows generically how the price of a thing varies with its supply: as the price increases, producers will produce more (no, it does not indicate that as producers make more, the price they can get goes up).  The two lines labeled D1 and D2 show before and after conditions of how price varies with demand for that same thing: for each line, as price goes down, more people want that thing.  The points labeled A and B simply show hypothetical equilibrium price and quantity for the two demand conditions—the price at which, in theory, everyone gets to buy that thing, and no one is left out; and after all that buying and producing, no single example of that thing is left over, every one produced has been bought.  Each D line represents a different population interested in buying that thing.

It’s useful to note that supply lines can shift, also; however, in most cases demand can change faster than supply so that supply will change after and in response to that demand shift.  The change from D1 to D2 occurs today; S will not shift until tomorrow—it takes time to add factories, hire and train workers, and so on.  S will, tomorrow, shift either to the right or to the left, depending on the producers’ actual reaction to the demand shift.
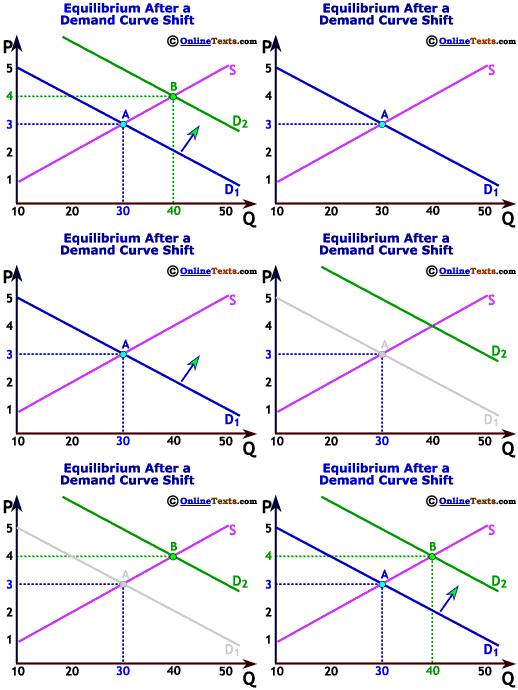
So what does this graph tell us about the effect of subsidies on the cost to all of us of the subsidized thing?  The folks on the D1 demand line represent the folks that can afford to buy the good today—pay for college, build an electricity generating station that uses solar energy exclusively, buy that solar energy-produced electricity for their homes, and so on.

The price for these on D1—Point A—is deemed by government to be too high; more folks “should” be buying these goods.  Government wants to help, so it offers a subsidy for the good.

It doesn’t matter what form that subsidy takes, whether it’s a direct payment to the buyer for the purpose of a specific purchase, a tax deduction—or credit, an even larger subsidy—after the fact for having made that purchase, a payment to the producer/seller for offering the thing at a “reduced” price for certain buyers, etc.  As a result of the subsidy, the population of folks who are interested in buying that thing changes—it expands—and the demand line shifts to the right: D1 moves to D2.  Everyone is happy, right?  But what happened to the price?  It went up: the equilibrium price now is at Point B.  Despite a larger quantity of the thing being available with current production facilities, the price everyone—subsidized and not subsidized—now is paying increased.  After the subsidy was provided, everyone began paying a higher price than anyone was before the subsidy was provided.  There’s more money available with which to buy that thing, so the sellers/producers are able to charge more.

Sure, the subsidized person is paying a relatively reduced price out of pocket, but to the extent he pays taxes—now or in the future—he’s paying a higher price when those taxes are added back in.  And those taxes are inevitable: either they’re current taxes to pay for the current subsidy, or they’re future taxes to pay for the current borrowing that provides the subsidy.  But the unsubsidized person also now is paying a higher price, both out of pocket and through those taxes.

This isn’t theoretical.  As Eric Falkenstein notes on his blog,

Federal college aid has risen 165% over the past decade, and college and college costs have risen about 74% over that same period.

Moreover, as recently as FY2007 (pre-Obama explosions) Federal subsidies for solar-generated electricity amounted to $24.34 per megawatt-hour and $23.37 per megawatt-hour for wind, compared with $0.44 for conventional coal and $0.25 for natural gas and oil.  In fiscal year 2010, the subsidies were  $775.64 for solar power and $56.29 for wind, but for coal, natural gas, and oil were still only $0.64.  Higher subsidies have exploded the total cost of solar and wind energy.
Some Thoughts on Energy Policy

The administration’s rap is that we only have 2% of the world’s oil reserves, and there’s that fossil fuel pollution problem, so we have to push green energy sources (which President Obama masquerades as an “all of the above” energy policy).

The good folks at the Institute for Energy Research have a different take on the matter.

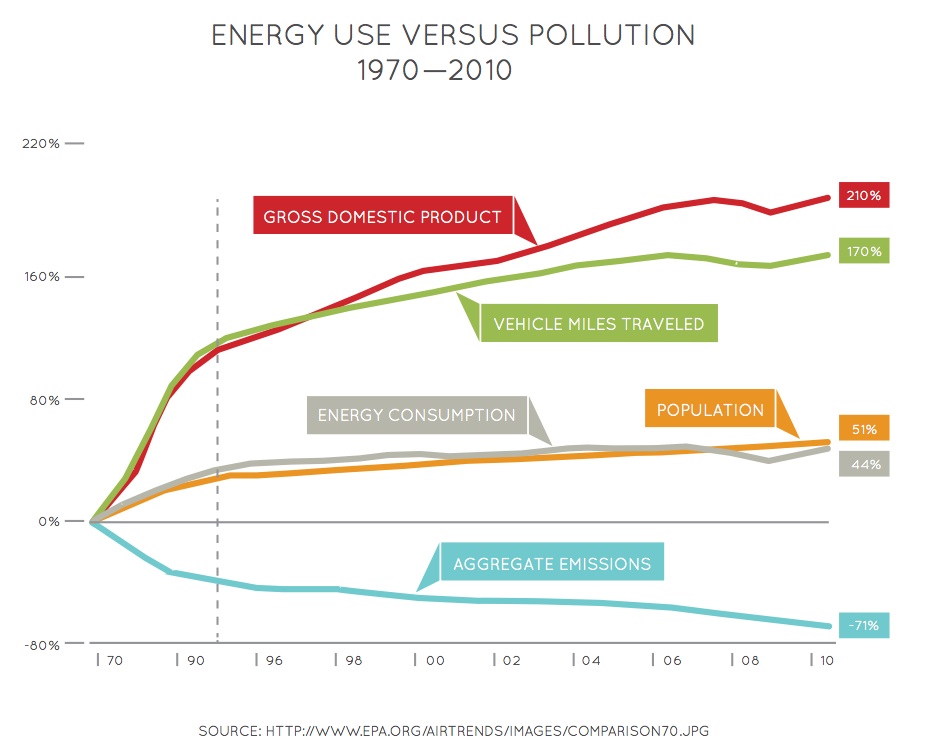
The figure below is a graph showing American population growth, energy use, economic performance, and pollution (emissions) rate since 1970 (the vertical dotted line is simply a break in the time scale from 20-year increments to 2-year increments).  It’s interesting to note that energy consumption per capita has been remarkably constant over these last 40 years.  Meanwhile, our GDP has gone up sharply, so that our energy use per unit of GDP—per unit of economic performance—has gone down sharply as we produce and use our energy more efficiently.  Also over that same time frame, our pollution rate—per capita and per unit of GDP—has gone…down.

Now, what about those miniscule reserves?

The reality is that we have more combined oil, coal, and natural gas resources than any other country on the planet. We have enough energy resources to provide reliable and affordable energy for decades, even centuries to come. The only real question is whether we will have access to our abundant energy resources, not whether sufficient resources exist. … According to the Congressional Research Service, we have the most fossil fuel resources of any country on Earth, but most of these resources are off-limits due to federal policies.

Indeed,

  • The United States is home to the richest oil shale deposits in the world—estimates are there are about 1 trillion barrels of recoverable oil in U.S. oil shale deposits, nearly four times that of Saudi Arabia’s proved oil reserves.
  • The United States has 261 billion tons of coal in its proved coal reserves. These are the world’s largest coal reserves and over 27 percent of the world’s proved coal reserves.
  • The United States has 486 billion tons of coal in its demonstrated reserve base [measured quantity of [coal] which, based on the geological and engineering data supporting proved energy reserves, can be recovered with presently available technology at an economically viable cost], enough domestic coal to use for the next 485 years at current rates of consumption. These estimates do not include Alaska’s coal resources, which according to government estimates, are larger than those in the lower 48 states.
  • The federal government leases less than 3 percent of federal lands for oil and natural gas production—2.2 percent of federal offshore areas and less than 5.4 percent of federal onshore lands.

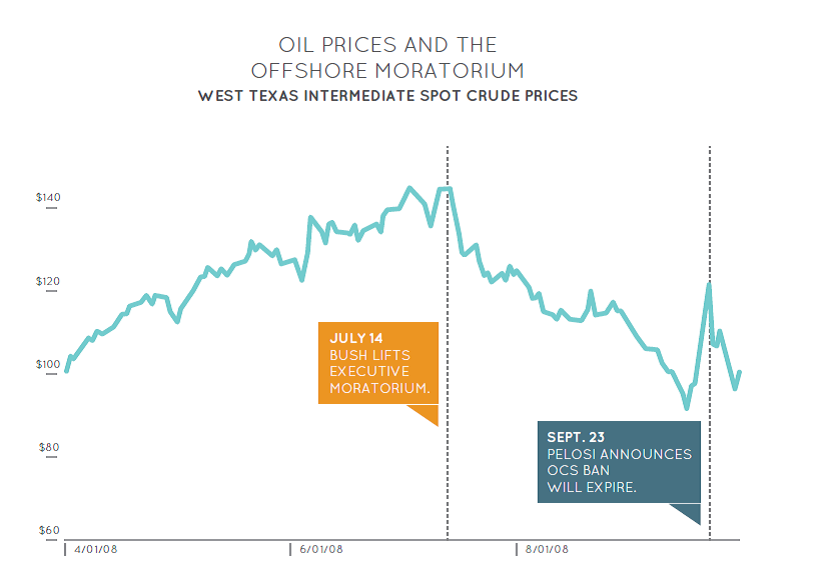
This graph shows one impact of government intervention in energy production.

Notice the price drops when government intervention is reduced.  On top of this, the Federal government leases less than 3% of its lands for oil and natural gas production—2.2% of Federal offshore areas and less than 5.4% of federal onshore lands.  Finally,

Total federal subsidies in fiscal year 2007 were $24.34 per megawatt hour for solar-generated electricity and $23.37 per megawatt hour for wind, compared with $1.59 for nuclear, $0.67 for hydroelectric power, $0.44 for conventional coal, and $0.25 for natural gas and petroleum liquids. In fiscal year 2010, the subsidies were even higher. For solar power, they were $775.64 per megawatt hour, for wind $56.29, for nuclear $3.14, for hydroelectric power $0.82, for coal $0.64 and for natural gas and petroleum liquids $0.64.

My energy policy? Pretty much akin to “Drill, Baby, Drill.”  And export the excess.  Push for more nuclear power plants.  Three Mile Island demonstrated that our safety systems work, even in extremis.  Encourage wind and solar farms, but not with those—or any—subsidies (eliminate those trifling subsidies for the other energy sources, too).  The free market will decide the economic viability of our sources of energy, and the free market is the only mechanism qualified to determine what is economically sound among the several energy sources.


h/t Power Line

Big Government and Economic Recovery

Via UCLA comes an analysis of the Great Depression and the failures of Big Government policies in alleviating what began as a sharp recession.  Harold L. Cole and Lee E. Ohanian, after studying Franklin Roosevelt’s performance, have reached a conclusion about the New Deal.

Why the Great Depression lasted so long has always been a great mystery, and because we never really knew the reason, we have always worried whether we would have another 10- to 15-year economic slump.  We found that a relapse isn’t likely unless lawmakers gum up a recovery with ill-conceived stimulus policies.

These two lay the responsibility for the failure, in particular, on the anti-competition and pro-labor measures FDR signed into law in 1933.  Even though much of that first New Deal round was found unconstitutional, that outcome took a couple of years to reach, during which the damage was being done, and it was replaced by similar New Deal laws that a later, more submissive Supreme Court upheld.

Cole added

President Roosevelt believed that excessive competition was responsible for the Depression by reducing prices and wages, and by extension reducing employment and demand for goods and services.  So he came up with a recovery package that would be unimaginable today, allowing businesses in every industry to collude without the threat of antitrust prosecution and workers to demand salaries about 25 percent above where they ought to have been, given market forces. The economy was poised for a beautiful recovery, but that recovery was stalled by these misguided policies.

The Cole and Ohanian study went on:

Using data collected in 1929 by the Conference Board and the Bureau of Labor Statistics, Cole and Ohanian were able to establish average wages and prices across a range of industries just prior to the Depression.  By adjusting for annual increases in productivity, they were able to use the 1929 benchmark to figure out what prices and wages would have been during every year of the Depression had Roosevelt’s policies not gone into effect.  They then compared those figures with actual prices and wages as reflected in the Conference Board data.

In the three years following the implementation of Roosevelt’s policies, wages in 11 key industries averaged 25 percent higher than they otherwise would have done, the economists calculate.  But unemployment was also 25 percent higher than it should have been, given gains in productivity.

Meanwhile, prices across 19 industries averaged 23 percent above where they should have been, given the state of the economy.  With goods and services that much harder for consumers to afford, demand stalled and the gross national product floundered at 27 percent below where it otherwise might have been.

And with those carefully elevated prices—deliberately elevated through mandated price floors and, with agriculture, government-controlled production rates—food was so expensive that FDR forced food stamps—and the taxes to support them—through the Congress.

Ohanian added this, too:

High wages and high prices in an economic slump run contrary to everything we know about market forces in economic downturns.  As we’ve seen in the past several years, salaries and prices fall when unemployment is high.  By artificially inflating both, the New Deal policies short-circuited the market’s self-correcting forces.

Does any of this sound familiar?  Under the present administration, with its Patient Protection and Affordable Care Act, its Dodd-Frank Act, its wholly unaccountable Consumer Financial Protection Bureau, it’s really not so unimaginable.  Under the present administration, that singles out private citizens and publicly castigates them for political donations to the wrong candidates, with its picking and choosing individual business—and whole industry—winners and losers, it’s entirely understandable.

Cole concludes,

The fact that the Depression dragged on for years convinced generations of economists and policy-makers that capitalism could not be trusted to recover from depressions and that significant government intervention was required to achieve good outcomes.  Ironically, our work shows that the recovery would have been very rapid had the government not intervened.

RTWT.


With a h/t to GayPatriot, who actually were writing about a different matter.

The Latest “Recovery” Numbers

First, some numbers via The Wall Street Journal:

  • Commerce Department: 2.2% growth for the first quarter of 2012.
    • down from 3% at the end of last year.
    • close to the 1.7% that all of 2011 had.
  • Recession-created pent up demand for cars and trucks accounted for half of that increase in GDP—1.1%.
    • “Real” growth in GDP, then, was 1.1%.
  • Businesses building up inventories accounted for another 0.6 percentage points of GDP growth.
    • Now we’re down to 0.5% “real” growth.
  • Businesses, over the last six months, have added inventory by more than $120 billion.
    • foretells lower business spending in the nearby future as that expanded inventory needs to be sold off.

As backdrop for all that, our GDP grew on the year by $600 billion, but Federal debt climbed by $1.3 trillion—more than twice GDP growth—in the same period.

Now, about President Obama’s enormous tax increase scheduled to take effect next January.  A worker’s Social Security tax bill will go up by nearly 50% as the payroll tax holiday expires, and his income tax bill will go up drastically: a lower income worker will see his first marginal tax go from 10% to 15% as Obama simply erases that 10% bracket, while a high-income worker will see his top marginal rate run up from 35% to 39.6%.

And this doesn’t include Obama’s tax increases on capital gains and dividends—levied on those rich investors like retired grandma for whom dividend income plays such a major role, and on those middle class investors—the ones whose 401(k)s or whose company-provided pensions invest for dividend and cap gain income.

Imagine the impact on GDP—and on the practical economy in which we must live—of these tax explosions.

A Thought on Taxes

With a tip of the hat to The Wall Street Journal, and a caution to those who insist on raising our taxes—including doing so only to certain governmentally disfavored groups.

Henry Hazlitt in “Economics in One Lesson,” 1946:

When a corporation loses a hundred cents of every dollar it loses, and is permitted to keep only 60 cents of every dollar it gains, and when it cannot offset its years of losses against its years of gains, or cannot do so adequately, its policies are affected. It does not expand its operations, or it expands only those attended with a minimum of risk. . . .

There is a similar effect when personal incomes are taxed 50, 60, 75 and 90 per cent. People begin to ask themselves why they should work six, eight or ten months of the entire year for the government, and only six, four or two months for themselves and their families. If they lose the whole dollar when they lose, but can keep only a dime of it when they win, they decide that it is foolish to take risks with their capital. In addition, the capital available for risk-taking itself shrinks enormously. It is being taxed away before it can be accumulated. In brief, capital to provide new private jobs is first prevented from coming into existence, and the part that does come into existence is then discouraged from starting new enterprises. The government spenders create the very problem of unemployment that they profess to solve.

What he said.