
Will We Get a Cut in our Gas Tax?

Now the Obama administration wants to let the states charge tolls for the use of the Interstate highway system. This is the system for which our road and fuel taxes have already paid; the states’ tax money is supposed to be for maintenance and repair of the system.

OK, fair enough. Those roads won’t repair themselves.

But we still pay those road and fuel taxes, and those funds are for maintenance and repair. This graph from the US Department of Energy, via the Center on Urban and Metropolitan Policy‘s Fueling Transportation Finance: A Primer on the Gas Tax, gives a breakout of what went into the price of a gallon of gas as recently as 2002.ComponentsOfGasPrice
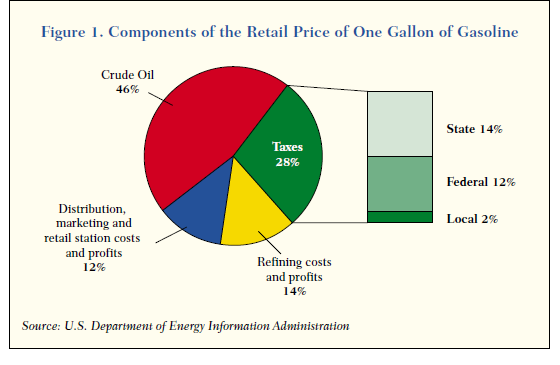
Federal taxes were 12% of the price, or about 44¢ per gallon here in north Texas (updated to 2014).

This graph, from the CBO via the same article, gives the 2001 breakout of Federal receipts for the highway trust fund.FederalHighwayTrustFundReceipts
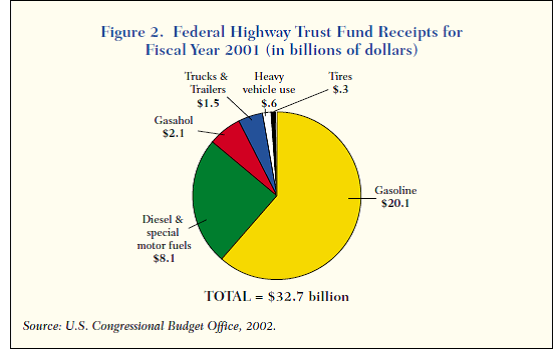
Gasoline and diesel fuels—car and truck fuels—comprise the vast bulk of the receipts.

This 2007 table from the Federal highway administration updates those breakouts.

Table 4. – User Fee Structure.
Tax Type Tax Rate
Gasoline and gasohol 18.4 cents per gallon
Diesel 24.4 cents per gallon
Special Fuels:
General rate 18.4 cents per gallon
Liquefied petroleum gas 18.3 cents per gallon
Liquefied natural gas 24.3 cents per gallon
M85 (from natural gas) 9.25 cents per gallon
Compressed natural gas 18.3 cents per 126.67 cubic feet
Tires: (maximum rated load capacity)
0-3,500 pounds No Tax
Over 3,500 pounds 9.45 cents per each 10 pounds in excess of 3,500
Truck and Trailer Sales 12 percent of retailer’s sales price for tractors and trucks over 33,000 pounds gross vehicle weight (GVW) and trailers over 26,000 pounds GVW
Heavy Vehicle Use Annual tax: Trucks 55,000 pounds and over GVW, $100 plus $22 for each 1,000 pounds (or fraction thereof) in excess of 55,000 pounds (maximum tax of $550)

Notice in the table that taxes are broken out, also, by vehicle weight. Trucks with tire capacity over 3,500 pounds are the trucks that ship our goods over the highways.

Cars and trucks—including those shippers—comprise the vast bulk of the Interstate highway users. Guess who’ll pay the tolls. And who’ll pay higher prices for the goods we buy after they’ve been shipped to the stores we frequent.

Will we see compensatory reduction in our fuel taxes, which as noted above already exist in major part to pay for interstate highway maintenance?

Fat chance.
Jobs Numbers

According to the headlines, our unemployment rate fell to 6.3% in April (from 6.7%); it hasn’t been that low since before the Panic of 2008. This also came as the private sector and state and local governments added 288,000 jobs. Good news, eh?

It is good news, for those 288,000 Americans. However. There’s always a however.

806,000 Americans gave up looking for work in this economy and dropped out of the labor force. The labor force participation rate fell to 62.8% (from 63.2% in March), the lowest rate in nearly 40 years. If this number had only held steady at March’s value, the unemployment rate would be in the 6.7%-6.8% range.

These data also come on the heels of our GDP datum for the first quarter of 2014, which ended in March: GDP grew at the sickly rate of 0.1% over the 4th quarter 2013.

The jobs report turns out to indicate a fine beginning for the second quarter of 2014.

Yet Another Thought on Social Security

James Pethokoukis, writing for AEIdeas, had one, and I have some thoughts on his thought.

Pethokoukis first:

To counter the anti-growth impact [of Americans’ of increasing lifespan and falling birthrates] you would need (a) greater labor-force participation, (b) higher birthrates, (c) greater innovation so each worker is more productive.

To which I add, (d) higher immigration rates with better assimilation into American society. We need more folks, with their fresh ideas, their initiative, their drive, their (conservative) family values and sense of responsibility, all of which are amply demonstrated by the lengths to which they go to get here.

Second [citing colleague Andrew G Biggs, who was writing in National Affairs], “Social Security’s government-provided benefits would be transformed into a flat universal benefit mean to improve social-insurance protections for low-income Americans.”

The short question is how to handle the erosive effects of inflation. That’s only partially, and hopefully, addressed by Biggs’ view that this would grow over time with wages. But there’s a larger problem, it’s in Biggs’ article, and it’s one that Pethokoukis missed.

The two parts of Biggs’ solution are these. First, enroll all workers in an employer-sponsored 401(k)/403(b) type device, with the employees required to contribute, say 1.5% of their pay and employers required to match that dollar for dollar. Second,

Social Security’s government-provided benefits would be transformed into a flat universal benefit to improve social-insurance protections for low-income Americans. … Each American reaching the normal retirement age would receive a benefit set at the poverty threshold for individuals over age 65….

The larger problem involves both of these, and both are solved by privatizing Social Security and making each person’s payments go into a retirement account for the payer’s future retirement rather than for strangers’ current retirement (they’re not even specifically for the payer’s parents’ current retirement).

We’re used to paying 6.2% of our payroll tax into social security. Pay those 6.2% instead into a retirement plan (401(k)/403(b), Traditional or Roth IRA, etc) whose proceeds are for the sole benefit of the payer, and which accounts are under the sole control of the payer, for his own future retirement. Also, remove the income and contribution caps. So what if the better off can pay in more in than can the less well off? Those larger payments in no way hurt the less well off, and the increased consumption available to those better off is good for the economy—and everyone else. Next, free the employer from the matching payroll tax altogether. The employer will benefit from that reduction in labor cost and can use the money to make the business more competitive—including matching employee retirement contributions as a competitive device—which will be good for hiring.

This makes each worker responsible for his future welfare, and he’ll do a better job of taking care of that than the government can, as demonstrated by Social Security’s current fiscal straits. It also eliminates the need for Biggs’ flat benefit for the less well off. Their own retirement accounts, allowed to accrue for their future benefit instead of being paid out immediately as Social Security does now, and at a faster rate than Biggs’ alternative, does the deed.

Jobs and Income in the Current “Recovery”

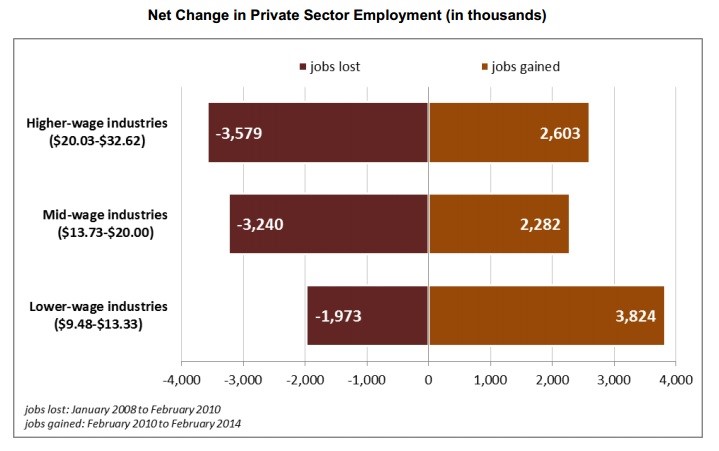
AEIdeas‘ James Pethokoukis has some data in his article, “Obama’s low-wage jobs recovery.” He talked about the type of jobs being…created…in this so-called recovery; the graph below highlights his point.NetChangeEmployment

There’s another aspect to this, though, and that’s the income implication of the type of jobs being created. I constructed the table below from the data in the graph above, using the mid-points of each industry type wage range and assuming a 2080 hour work year—that is, everyone, even the low-wage industry worker, either works all 52 weeks of the year or gets paid in full for vacation time, including holidays, to keep the arithmetic simple.

Wage Mid-Point Jobs Lost (Thousands) Jobs Gained (Thousands) Not Jobs Gained (Thousands) Net Annual Wages Gained/Lost (Thousands $)
High Wage: $26.3250 (3,579) 2,603 (976) ($53,441,856)
Medium Wage: $16.8650 (3,240) 2,282 (958) ($33,605,874)
Low Wage: $11.4050 (1,973) 3,824 1,851 $43,910,162
Total: ($43,137,567)

You’re reading that right. The only net gain in income is in the low end industries; these folks, by being able to go back to work, have gotten a net increase of some $44 billion in their annual income. But that’s swamped by the losses in the other two categories, and the nation as a whole has lost some $43 billion in annual income.

This is a fine recovery, yes, indeed.

Income Inequality and Blinders

The impact of Obamacare, still being denied in some circles:

In January, nearly half of small-business owners with at least five employees, or 45% of those polled, said they had had to curb their hiring plans because of the health law, and almost a third—29%—said they had been forced to make staff cuts, according to a U.S. Bancorp survey of 3,173 owners with less than $10 million….

And

Given how much the President talks about income inequality, it is perhaps ironic that his signature achievement is preventing people from earning incomes.

ObamaCare-induced phenomenon of “29ers”—employees held below 30 hours of work per week to avoid counting as full-time workers eligible for employer-provided health insurance. As a Journal editorial explained last year, “The savings from restricting hours worked can be enormous. If a company with 50 employees hires a new worker for $12 an hour for 29 hours a week, there is no health insurance requirement. But suppose that worker moves to 30 hours a week. This triggers the $2,000 federal penalty. So to get 50 more hours of work a year from that employee, the extra cost to the employer rises to about $52 an hour—the $12 salary and the ObamaCare tax of what works out to be $40 an hour.

Hmm….