
A Short History Lesson

Much ado has been made about the Great Depression and of the Panic of 2008, whose effects we’re still feeling.  Here is a brief history of another economic depression, one that could have had devastating impact, the depression that occurred in the US in 1920-1921.

In the 18 months between January 1920 and August 1921, our unemployment rate jumped to 14% or so from about 2%, as estimated from the times’ inexact records; wholesale prices fell more than 40%; and industrial production fell 23%.  From peak to trough, the total of checking accounts and currency fell by nearly 11%.  Some today might have considered the survival of the banking system as a whole to be in the wind.  The farm economy also was hard hit, and there were waves of business failures.  What interventions did the government effect to rescue the nation from this devastation?  The most effective intervention a government can execute with a free economy: it sat on its collective hands and let the economy right itself.

The Harding administration very deliberately ran a budgetary surplus. The Fed, with less than a decade’s worth of bad habits to influence it, raised interest rates, increasing the cost of money (and increasing the value of savings).   In response, the economy in 1922, the first full year of recovery, increased industrial production more than 27%, and by 1923, unemployment was back down to 3%.

What happened?  Market forces, unfettered by Know Betters in the government, happened.  The US and our goods and services were dirt cheap, and bargain-hunting investors from overseas jumped on the opportunity with both feet.  No central banker had to instruct investors in what to do with bargains.  Money flowed into the US, and this inflow delivered a powerful monetary stimulus.

Moreover, that 40% drop in prices meant that Americans’ dollars were able to buy more.  This increase in the value of our money—wonks call it the “real balances effect”—enabled Americans in our aggregate to begin again to buy goods and services.  Which stimulated demand for new production, which stimulated job creation.

And those banks that a Hank Paulson might have panicked over?  The biggest casualty was the little First National Bank of Cleburne, Texas, with its deposits of $2.8 million. That certainly hurt those Cleburne depositors, but the damage was that limited.  No bank was “too big to fail” in those days, and no big bank did.

That depression lasted all of 18 months, and over its course—one more little tidbit—the nation’s debt was reduced by nearly 6%, to a shade under $23 billion.  The Great Depression lasted 10-17 years (depending on who you read) and added billions to our debt—even before WWII, and the Panic of 2008 is still being felt four today, years later, and our national debt still is exploding by trillions of dollars per year.

Yet the Obama administration has cynically ignored the lessons the Harding administration could teach about not intervening in a free economy.  Rather, Obama and his “advisors” have chosen to listen to a fellow Progressive, Franklin Roosevelt, and so to ignore the manifest failures of government intervention into that more publicized depression.  Obama has chosen to double down on those failures with his own interventionist policies, which are exacerbating the Panic of 2008, and the ongoing recession still ensuing (never mind the “official” end of the recession in 2009—ask the millions of Americans who are out of work, and the millions more who have given up and abandoned the labor force altogether, how their recovery is going).

Worse (if that’s possible), the supposedly independent Federal Reserve System has been entirely complicit in these interventionist policies, what with its freely running dollar printing press, its QE2 (preceded by a QE1—why do these sound like failed luxury cruise liners?), its Twist, its artificially depressed interest rates (so much for the widows and orphans who need their savings for living), and so on.
Progressives Didn’t Get It then, Either

[I]n a free enterprise economy, increased production increases the number of jobs.  It might be said that one job creates another, which is true as far as it goes, but open to misinterpretation; for only productive employment does that.  If a man were paid to pick up pebbles on a beach and throw them into the ocean, it would be just the same as if he were in a “government job,” or on the dole; the producers have to supply his subsistence with no return, thus preventing the normal increase of jobs.  Putting the unemployed on the dole does not increase “purchasing power.”  The dole divides up what is already in production.

Isabel Paterson understood this in 1943 in her The God of the Machine [the emphasis is hers], and FDR’s Secretary of the Treasury, Walter Morgenthau, had come to understand it as early as 1939.  But the Progressives then didn’t get it, and the Progressives today still don’t.

Keynesian economics simply does not work in the real world.  Government spending, whether on “jobs” programs or on other goals, is not stimulative; it is depressive of an economy, in no small part by crowding out private demand and private spending for products—and here by increasing the cost of private labor.  The taxes and the borrowing—which are future taxes—which must occur in order to pay for the spending are even more depressive.  The taxes take money out straight out of the hands of the people who have the most interest in its value and the clearest understanding their purpose for their money, and they give it to government bureaucrats for spending on government purposes, whose loftier goals are handed down from on high by fiat.  Meanwhile, the government’s borrowing drives up the cost of debt for private borrowers, who have more carefully thought out purposes for the loans and more carefully thought out plans for repaying those loans.

Paterson’s remarks about jobs and productive jobs, in particular, also were clear then, as she wrote in the era of FDR’s Civilian Conservation Corps.  The distinction is just as clear today, with the added fillip that at least the CCC laborers were doing something.  The present administration’s “jobs” programs have done nothing.  They haven’t even produced jobs, as this note illustrates.

These things were apparent in the latter stages of the New Deal, and they’re apparent today.  This fall, we will have an opportunity to confirm our choice of two years ago and to strengthen it, or to repudiate it.  This fall, we must choose wisely.

Unemployment and Unemployment

Last Friday, the Bureau of Labor Statistics jobs data were released.  Superficially, they seem encouraging—the unemployment rate dropped a tenth of a point to 8.1%, the lowest rate since the month of President Obama’s inauguration.  Moreover, nonfarm payroll employment rose by net 115,000 (130,000 new private sector jobs against a loss of 15,000 government sector jobs).  But the data behind these numbers are appalling.

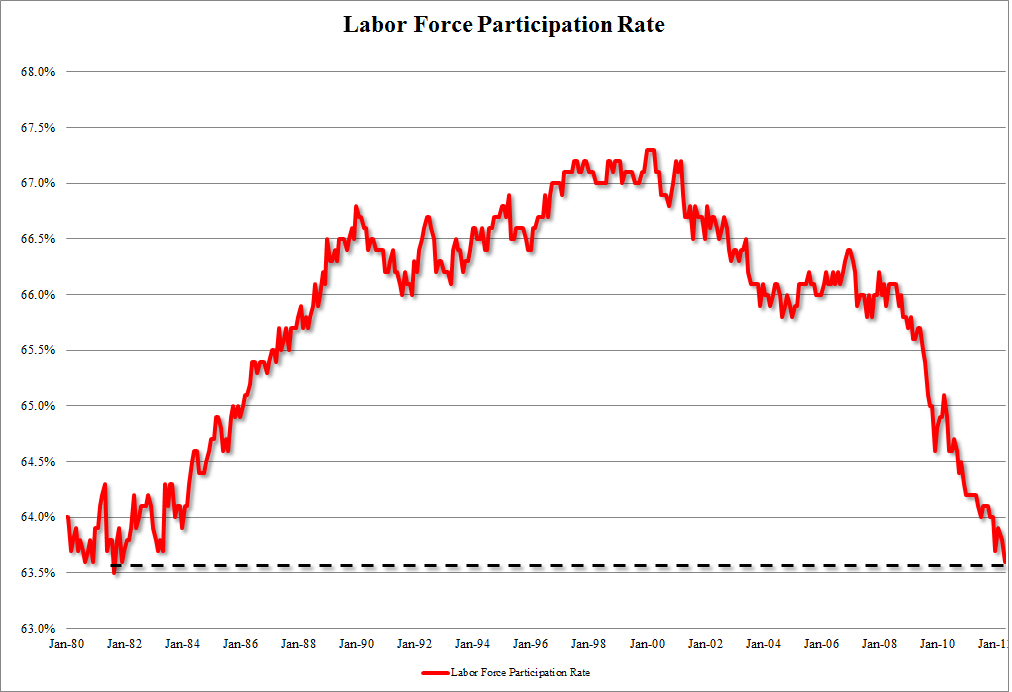
By April, the number of people not in the labor force at all had risen to nearly 88.5 million, the highest non-participation rate on record.  Indeed, this is a rise of over half a million (ex-) workers just since the March data release.  This has driven the labor force participation rate—the per centage of our population that hasn’t yet given up and are still actively working or looking for work, to 64.3%, a 30-year low.  Other estimates confirm this: 342,000 people dropped out of the labor force, while the ranks of the unemployed fell by just 173,000.

The Wall Street Journal also reported [emphasis added]

Friday’s report was weak across categories.  Manufacturing employment, an area of strength in recent months, grew by a disappointing 16,000 jobs.  Construction employment fell slightly.  Full-time employment plunged by more than 800,000 jobs.

That’s why that headline unemployment rate dropped.  The unemployment ratio is a fraction consisting of the number of people out of work divided by the number of people working or looking for work, and more people gave up and left the work force—became non-persons in the eyes of the Government’s jobs bean counters—than found jobs.  The number of people left who are working or looking for work shrank precipitously.

A couple of pictures illustrate the story.  (The graphs might be a little hard to read.  The Labor Force Participation Rate graph is in two-year increments from January 1980, and the Persons Not In Labor Force is in three-month increments from December 2007.)

The number of folks wanting to work, that labor force participation rate, rose rapidly in the optimism of the Reagan economic boom into the dot-com bubble.  When the bubble burst, participation rate fell off, but was recovering during Bush the Younger’s second term (when his own tax cuts were starting to take effect) until the Barney Frank housing bubble burst.  And during the Obama administration, the participation rate has fallen off a cliff, as more and more Americans give up due to the current administration’s policy failures and stop looking altogether for work.

Beginning with that housing bubble starting its failure, the population no longer in the work force began running up more steeply, and it’s continued without break throughout the present administration’s set of “economic” policies.


h/t GayPatriot

Some Thoughts on Student Debt

Having railed about Federal government debt for a bit, I got interested in student debt—an other end of the scale.  Specifically, I got curious about who borrowed, by chosen major field, and what the outcomes might be of those borrowings, based on salaries for jobs in those fields.  Much of the data in this post come from Steven A Harrast’s paper, Undergraduate Borrowing: A Study of Debtor Students and Their Ability to Retire Undergraduate Loans, which can be found here.  The data in this paper are from 2003-2004, so they predate the current economic dislocation, but the principles, I think, are intact.  The paper has a lot of good information in it; RTWT.

Using a student loan calculator, we can see some expected first year salaries and “affordable debt” suggestions for a number of majors.  I’ve selected four to be used illustratively throughout this post, and I used the calculator’s default values otherwise.

Major

Starting Salary

Maximum Manageable Debt Load

Sociology

$35,300

$35,976

Education

$35,900

$36,587

Engineering

$56,600

$57,683

Mathematics

$50,000

$50,957

These outcomes hold generally: the maximum manageable debt load is roughly the first year’s salary.  More than that is “excessive borrowing;” although this is a squishy limit.  Harrast defined excessive borrowing as “the difference between debt at graduation and lender-recommended debt level,” where the latter is based on an ability to pay 8% of a graduate’s second-year salary.  Others consider excessive debt to be total debt (which would include credit card, mortgage, if any, and the like, in addition to student loan debt) greater than 37% of income, which would lead most lending institutions to decline to lend.  All three definitions lead to substantially the same amount of “excess” for the purposes of this post.

Also, it’s clear that STEM-type majors (Science, Technology, Engineering, Mathematics) pay more, and so can borrow more, than do non-STEM majors.

Who incurs excessive student debt?  According to Mark Kantrowitz, of FinAid.org, that breakout looks like this for our example majors.

Major

Per Cent Overborrowing

Sociology

5.7%

Education

4.3%

Engineering

3.5%

Mathematics

3.6%

STEM students do better at managing their greater debts.  And importantly so: the overall average per cent of students excessively borrowing, across all majors, was 4.1%.

It’s also useful to lower the bar a bit and look at the size of excessive debt, given that it exists.  One way of looking at this is to look at the 75th percentile borrowing.

Major

Student Loan Debt at Graduation

Excess Student Loan Debt at Graduation

Sociology

$30,888

$11,795

Education*

$26,944

$7,850

Engineering**

$22,239

$3,146

Mathematics***

N/A

N/A

*Here, an average of Consumer Science and Education and Special Education
**Here, an average of Electrical and Mechanical Engineering
***Data were not provided by Harrast.

Plainly, some jobs are more valuable than others.  More importantly, the rigor associated with learning those jobs seems to correlate well with the ability of students to manage their debt buildup, and of the newly graduated to manage their accrued debt.

As some have asked,

Want to major in gender studies, women’s contemporary literary issues, or African-American history? Feel free, but don’t expect a dime from the US taxpayer. Because you likely won’t be able to pay your debt, and you most likely won’t be able to find a job to support yourself. Which means the degree is essentially worthless. And that is a luxury this country cannot afford any longer.

Jobs

The March Jobs report said there were 120,000 nonfarm jobs added in March, compared to economists’ expectations of 200,000 jobs and some 267,000, 275,000, and 240,000 added in December, January, and February, respectively.  The report also said that the population of folks actively looking for work—the denominator in the headline unemployment rate—shrank by 161,000 to 63.8% American adults as yet more people gave up on our suppressed economy and stopped looking for work.  This participation rate has fallen steadily for the last three years, from its nearby high of 65.8% in January 2009.

The long-term unemployed (jobless for 27 weeks and over) remained at 42.5% of the total unemployed.

Meanwhile, initial jobless claims increased by 13,000 to a seasonally adjusted 380,000 in the week ended April 7.  This also is the largest jump in a year.

Keep in mind that one month does not make a trend.

But.  Our economic recovery is in full bloom, all right.