
Some Thoughts on Freedom and Income

I guess today is my day for pretending to think.

Progressives have been trying to score political points by bellyaching about income inequality and pretending there’s something to this.  A couple of graphs from the Fraser Institute’s Free the World project bear on this.  The graphs below, in particular, are from their report for the year 2008; their latest report, dated 2011, covers the year 2009, and it’s not materially different vis-à-vis the poor.  Emphasis added, and kindly excuse the poor formatting.

The Institute’s reports also rank the world’s nations along various dimensions of economic freedom; there is a significant degradation in our freedoms and rankings between 2008 and 2009, as I’ll mention at the end.

Exhibit 1.8: Economic Freedom and the Income Share of the Poorest 10%

The share of income earned by the poorest 10% of the population is unrelated to economic freedom.

Sources: Fraser Institute, Economic

Freedom of the World: 2010 Annual Report;

World Bank, World Development Indicators.
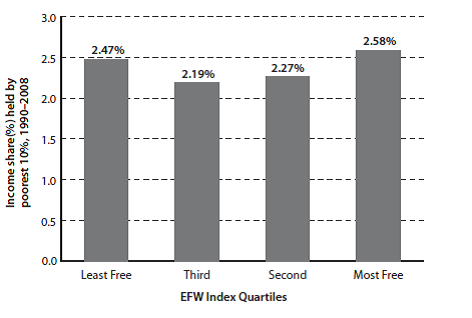
Now let’s look at another aspect of the poor’s situation.

Exhibit 1.9: Economic Freedom and the Income Level of the Poorest 10%

The amount, as opposed to the share, of income earned by the poorest 10% of the population is much higher in countries with greater economic freedom.

Sources: Fraser Institute, Economic

Freedom of the World: 2010 Annual Report;

World Bank, World Development Indicators.
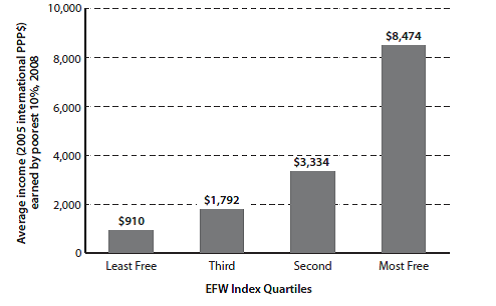
This is dramatic.  While the poor’s share of the wealth is independent of the degree of freedom in the country in which they live, their wealth in absolute terms is enormously greater, and it gets more so as the degree of freedom increases.  The poor of a free nation are far better off than the poor of a tyranny.  Of course this is not reason to disregard the relative plight of the poor in any nation.  Certainly, after (and only after) private and local community aid efforts for the needy (who are, in fact, only a subset of the poor) have been exhausted, an argument exists for aid at the state level (now speaking for the United States alone), to be followed—only as a last resort—by  Federal assistance to state-tailored and -run work-for-assistance programs for the few remaining that need assistance.

One more thing: where the US sits on the freedom scale is instructive.

The following small table is excerpted from Exhibit 1.5 from the same report as the graphs above.  The year is the year for which the rating is valid; the ratings themselves are on a scale from 1-10, with 10 being most free.  For context, the US is rated as 6th most free in the world, overall, with Hong Kong the freest and Chile ranked number 5.

Year        1970  1975  1980  1985  1990  1995    2000    2001    2002   2003   2004  2005  2006  2007  2008

US          7.74    7.83    8.03    8.18   8.43   8.32    8.45     8.23     8.22    8.17     8.15   8.07    8.01    8.08   7.93

Hong Kong 8.99   8.85   9.21   8.81   8.76   9.11    8.82     8.76     8.76    8.81     8.75   8.94    8.95    9.00   9.02

Chile      4.31   3.93    5.56    6.18    7.02   7.47    7.28     7.47     7.59    7.75     7.67   7.94    7.97    8.08   7.99

Notice the freedom trend for the US.  We were at our freest in 2000, then the Federal government began increasing the degree of regulation it forced onto our economy—both business and individual.  Yes, the Progressive rap on the Bush years is that he deregulated, and did too much of it.  But on this, as with so many things, the Progressives are wrong.  By 2008, the US only ranked 26th in our freedom to trade internationally and our business regulatory controls.  Appallingly, our credit market regulatory regime ranked only 103rd.  (As an aside, despite Congressman Ron Paul’s concern about the soundness of our money, as of 2008, we ranked number 2, with Japan at number 1.  Of course a lot has changed since 2008: in 2009, our rank fell to 11.)

And the degree of regulatory control has exploded under the Obama administration.  This has driven our ranking in overall regulatory freedom from 17th in 2008 down to 27th just in Obama’s first year, 2009 (we were 2nd in 2000).  Associated with this, the per centage of Americans living below the Federal poverty level has grown to historic highs these last three years.
More on (Un)Employment

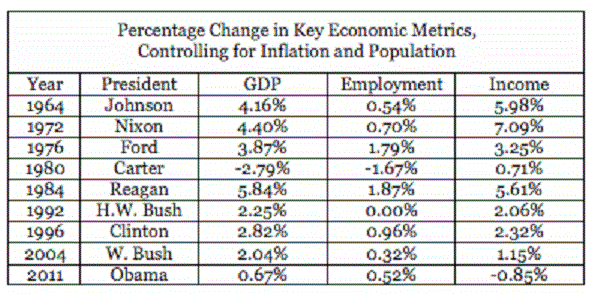
The Weekly Standard‘s Jay Cost has some thoughts on the recently reported headline jobs data.  The perspective into which these headline data fit can be neatly summarized in a table and a graph.

One aspect of this perspective is the overall economic situation in which the present data sit.  This table shows that situation for the last several Presidential election years. It’s true enough that the President Obama’s Employment growth number isn’t too different from those of past presidents in election years.  Keep in mind, though, that Obama’s number is for employment growing from an historically low employment condition: in December 2009, after a year of Obama Stimulus, unemployment was over 10%, with 15 million Americans unemployed.  Obama’s policies in 2011 have produced 0.52% annual growth against that start.  In short, we’re maintaining/growing employment very slightly at our present high unemployment rate, just as during the Clinton and Bush the Younger years, we maintained/grew employment very slightly in a time of already full employment.

Now look at those 2011 GDP and Income growth rate numbers.  They haven’t been that bad—our economy hasn’t been in such sad shape—since the Carter years.  That nearly flat employment growth rate is occurring in a terribly weak economy.

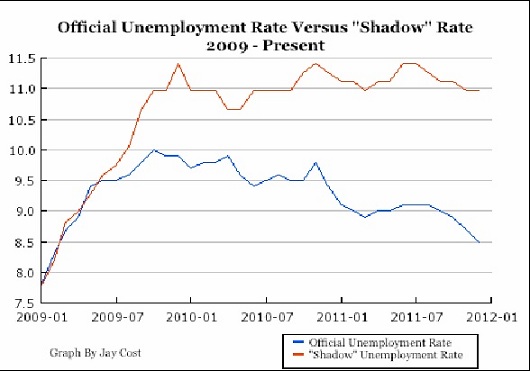
Now let’s look at the unemployment rate itself.  Cost’s graph is informative here.

Just in case the legend isn’t clear/legible, the blue line is the Official unemployment rate, as reported by the Obama administration.  The red line is the “Shadow” unemployment rate, about which neither this administration nor the NLMSM want to talk much.

As Cost points out, much of the decline shown on the Official unemployment (but not all, to be sure) is caused by the shrinking work force, as long-term unemployed give up and stop looking for jobs.  Indeed, as Cost says

Because of the length of this jobs recession, the number of people who claim to be in the workforce is near a 30-year low, and it has dropped substantially since Obama first took office (from 65.7 percent to 64 percent).

and

If we recalculate the unemployment rate based on the percentage of adults who said they were in the workforce at the start of Obama’s tenure, we get [the “Shadow” unemployment rate shown by the red line].

Maybe

…Value Added Taxes aren’t all they’ve been cracked up to be.  The Wall Street Journal reports

China has removed a value-added tax on vegetable distribution retroactively to Jan. 1 as part of efforts to curb rising food prices, which have contributed to inflationary pressure over the past year.

Lifting the VAT on vegetables will lower production costs for wholesale retailers, who typically pass such costs on to consumers.

and

“The lower costs benefit distribution companies, especially vegetable wholesalers,” said Gao Wang, an analyst at Beijing Orient Agribusiness Consultant Ltd.

A year ago, Beijing launched a wide-ranging government drive to increase food supplies, and had taken aim at improving the nation’s agricultural production distribution as part of that effort.

Hmm….

(Un)employment

The initial employment numbers from December were quite favorable: roughly 200,000 new jobs were added, almost all in the private sector (government employment shrank a small amount), and the unemployment rate ticked down to 8.5%.  These are numbers worth watching, as a recovery may be in progress, despite President Obama’s economic policies.  But  these numbers don’t tell the whole story.

First, Seeking Alpha describes some of “the rest of the story.”  When the current malaise, loss of our edge, and descent into laziness began in December 2007, the civilian non-institutional population* of the United States was 190 million, and the labor force was a tad over 125 million.  As of December 2011, the Bureau of Labor Statistics says that the “civilian non-institutional population” had increased to roughly 194 million, or 3.7 million higher (the difference includes rounding error from my own rounding) than it was those four years ago, and the labor force was 124 million.  BLS also says  that the employment population ratio was 58.5% as of last month.   Multiplying the increase in the U.S. population over the four years by the employment population ratio, says Seeking Alpha, implies that our labor force should have increased by 2 million to more than 127 million, not decreased to the 124 million actually reported: more than three million people are missing in the BLS figures.  (Note that, given the way the unemployment rate is calculated, a smaller labor force produces a better (headline) unemployment rate: dividing the number of employed in December 2011 by the size of the labor force that should exist based on the BLS’ population numbers gives us an unemployment rate of 9.6%, not 8.5%.)

What about those 3 million people, then?  The BLS says these folks left the labor force and that this justifies purging them from the statistics.  It’s certainly true that if 3 million Americans left the labor force—gave up and stopped looking for work—it’s valid for them to be scrubbed from the employment numbers.  (As an aside, note that this departure from the labor pool is a continuing trend: 2011’s labor pool is smaller than 2010’s, despite an increasing total national population.) Thus, it’s not inaccurate—as far as it goes—to say that of the population looking for work, their unemployment rate is the reported 8.6%.  But now think about what it means for 3 million folks to have just given up on finding jobs.  It’s clear that the current recession is continuing (yes, yes, I’m aware that by the consecutive quarters official measure, this recession ended ‘way back in 2009—see how your unemployed neighbor, or your spouse, or yourself feels about that), and no economic recovery has taken place or is in progress.

The Wall Street Journal describes another aspect of the story concerning long-term problems that exist and that will persist as a result of this prolonged recession.

Long-term unemployment remains above 15%, down only trivially from 15.3% to 15.2% last month.  Additionally, our labor market has, over the last 20 years, lost much of the edge it enjoyed over other developed countries.  Some of this is due to the deterioration of our education system, so that our relative gains from the last century due to our education are disappearing.  There are demographic causes, too: we relocate less frequently and change jobs less often, which makes the job market less flexible, as employers are less able to find the workers they want.  If the desired worker isn’t local, the employer has to do without, pay more for more training, or pay more for relocation costs.  And as seen above, a smaller share of us are working.

Additionally, there are 5.6 million Americans that have been unemployed for more than 6 months, and of these, 3.9 million have gone unemployed for a year or more.  Indeed, these 5.6 million out of work for half a year or more represent fully 42.5% of our unemployed.  This, of course, is in addition to those millions that have given up on finding a job.  This long-term unemployment rate forms a vicious circle, also.  The longer people go unemployed, the less (re)hirable they become.  Reasons for this vary, but they include deterioration of skills and the stigma of having already been long-term unemployed.  This can lead, domestically, to the same situation that has occurred in Europe: an underclass of semi-permanently unemployed labor develops, with all of the negative implications for any hope of overall productivity, and regardless of what we might think of social welfare programs, for those programs as well.

There’s another dimension to this negative feedback loop: a National Bureau of Economic Research Working Paper, “Recessions and the Cost of Job Loss,” by Steven Davis and Till von Wachter found that workers who lose their job when unemployment is low—below 6%—lose on average 1.4 years’ worth of earnings.  This is bad enough, but it turns out that those who lose their jobs when unemployment is above 8%—the current jobless population—lose 2.8 years’ worth of their pre-job-loss wages, or twice as much.  Von Wachter, et al., also found that unemployed workers’ earnings fall 1% for each additional month they’re out of work (recall the long-term unemployed numbers above), and that those losses can last for years even after they find another job.  There’s further fallout from this: those lower earnings result in less revenue for government regardless of tax rates and regardless of what we might think of how much money government actually needs.

The longer the government stays in the way of the economy and our recovery, the worse our economy will be and the more difficult and slow any recovery will be because the more entrenched these feedback loops will get.

*BLS-speak for “persons 16 years of age and older residing in the 50 States and the District of Columbia who are not inmates of institutions (for example, penal and mental facilities and homes for the aged) and who are not on active duty in the Armed Forces.”

Basic Economics

A thought on Keynesian economics.  Brad DeLong offers this thought concerning our current debate over government spending:

The government purchases $100 billion of goods, issues $100 billion of bonds, and raises taxes by $3 billion a year in order to amortize the bonds.  Government purchases go up by $100 billion this year.  Private consumption goes down by $3 billion this year.  Net fiscal impetus is not $0 but rather $97 billion.  Cochrane [and other Keynesians] doesn’t understand the Ricardian Equivalence argument he is trying to make.

Keynesians think $97 billion were created through this spending and taxing program and that government spending is a good.  But having sold $100 billion in bonds generate this “demand increment,” from where would those $100 billion have come, and to where would they have gone otherwise?  The Keynesian view can be summarized in either (or both) of two ways: supply creates its own demand, or demand creates its own supply. Talk about trickle down, or building fields of fancy and hoping fanaticizers come.

No, what goes on actually is this.  Falkenblog commenter Aaron Brown explains:

The main point is…that people react to the $100 billion future tax increase (or spending cut, or reduction in value of nominal assets from inflation, or some other loss).  You might argue that people will under-react in some cases, but it’s highly implausible that they don’t react at all, or that they systematically under-react (and there’s no data supporting either implausible contention).  I think systematic over-reaction is plausible (although also has no empirical evidence) since once currency debasement begins i[t] almost always seems to accelerate.

The question of where the $100 billion would have gone otherwise is a different one.  It could come from private consumption or private investment, in either case likely making the net effect of the stimulus spending negative, even before factoring in the future costs.  Government takes money today from privately-selected uses to government-directed ones (loss of utility there) and also must take money tomorrow from privately-selected uses to repay the debt.

And since the economy continues to be depressed from the government having withdrawn so much money from it for its own spending, government must, apart from tomorrow’s taking for current borrowing, repeat the whole borrowing and taxing cycle tomorrow, also.  This continues to hold down the economy, as we saw with the government’s “stimulus” spending in the Great Depression, and as we’re seeing today.  Brown continues:

The Keynesian hope is that today’s $100 billion comes from hoarding or asset bubbles, in which case the net effect could be neutral or even positive.  The further hope would be that the future debt repayment will go to sound private investment or elimination of future wasteful spending (sort of “stuff then starve the beast”).

However “hoarding” and “bubble” are in the eye of the beholder. So even if you make the assumption people under-react to the future implications of stimulus spending, you also have to assume that the government’s judgment using other people’s money, with officials being paid whether they are right or wrong, is better than people making choices with their own money, bearing the losses if they are wrong.

If people are correctly preparing for future bad times instead of “hoarding” or correctly anticipating a rise in nominal asset prices instead of feeding a “bubble”, then the stimulus will be doubly harmful.

But the fact is, we don’t hoard.  We (both individual and business) save/invest.  We may have a good idea of why we’re saving—a new house, future retirement, or future expansion—or we may not, saving only against an inchoate reservation about the future—but this isn’t “hoarding.”  And government judgment?  We’re seeing how that’s playing out with the government’s substituting its judgment for ours in its use of our money for its entitlement programs.  Keynesians are all about the superiority of government’s judgment.  Otherwise, they wouldn’t keep taking our money and spending it for us, even (especially) when we don’t want to spend, in order to stimulate our economy (which, just incidentally, Keynesians also view as government’s economy).

h/t to Eric Falkenstein at Falkenblog.