Unemployment and Unemployment

Last Friday, the Bureau of Labor Statistics jobs data were released.  Superficially, they seem encouraging—the unemployment rate dropped a tenth of a point to 8.1%, the lowest rate since the month of President Obama’s inauguration.  Moreover, nonfarm payroll employment rose by net 115,000 (130,000 new private sector jobs against a loss of 15,000 government sector jobs).  But the data behind these numbers are appalling.

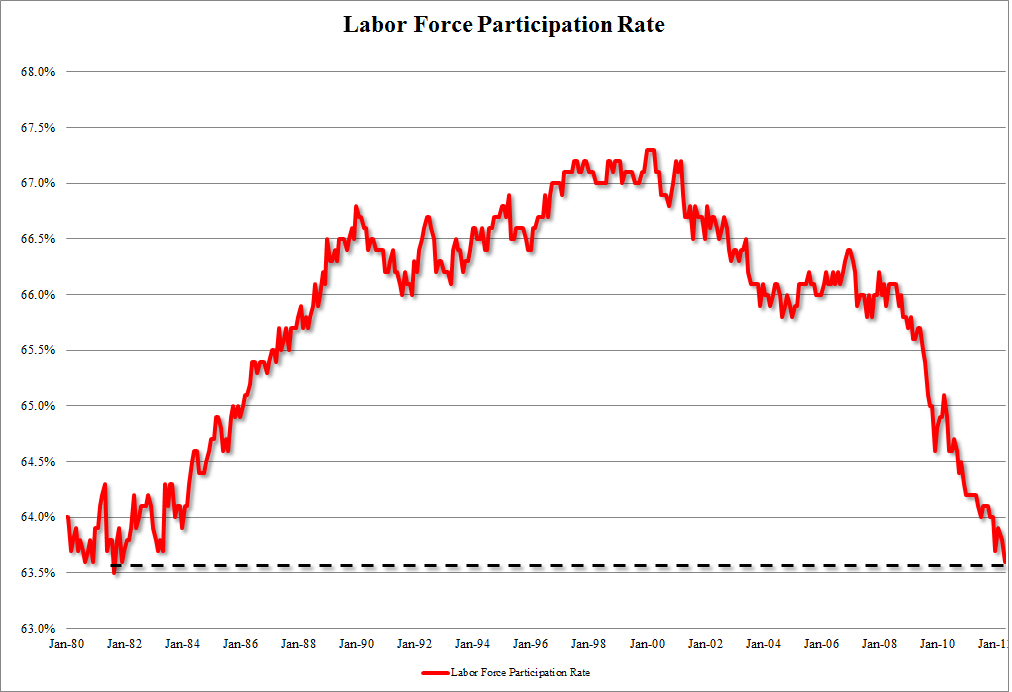
By April, the number of people not in the labor force at all had risen to nearly 88.5 million, the highest non-participation rate on record.  Indeed, this is a rise of over half a million (ex-) workers just since the March data release.  This has driven the labor force participation rate—the per centage of our population that hasn’t yet given up and are still actively working or looking for work, to 64.3%, a 30-year low.  Other estimates confirm this: 342,000 people dropped out of the labor force, while the ranks of the unemployed fell by just 173,000.

The Wall Street Journal also reported [emphasis added]

Friday’s report was weak across categories.  Manufacturing employment, an area of strength in recent months, grew by a disappointing 16,000 jobs.  Construction employment fell slightly.  Full-time employment plunged by more than 800,000 jobs.

That’s why that headline unemployment rate dropped.  The unemployment ratio is a fraction consisting of the number of people out of work divided by the number of people working or looking for work, and more people gave up and left the work force—became non-persons in the eyes of the Government’s jobs bean counters—than found jobs.  The number of people left who are working or looking for work shrank precipitously.

A couple of pictures illustrate the story.  (The graphs might be a little hard to read.  The Labor Force Participation Rate graph is in two-year increments from January 1980, and the Persons Not In Labor Force is in three-month increments from December 2007.)

The number of folks wanting to work, that labor force participation rate, rose rapidly in the optimism of the Reagan economic boom into the dot-com bubble.  When the bubble burst, participation rate fell off, but was recovering during Bush the Younger’s second term (when his own tax cuts were starting to take effect) until the Barney Frank housing bubble burst.  And during the Obama administration, the participation rate has fallen off a cliff, as more and more Americans give up due to the current administration’s policy failures and stop looking altogether for work.

Beginning with that housing bubble starting its failure, the population no longer in the work force began running up more steeply, and it’s continued without break throughout the present administration’s set of “economic” policies.


h/t GayPatriot

Some Thoughts on Student Debt

Having railed about Federal government debt for a bit, I got interested in student debt—an other end of the scale.  Specifically, I got curious about who borrowed, by chosen major field, and what the outcomes might be of those borrowings, based on salaries for jobs in those fields.  Much of the data in this post come from Steven A Harrast’s paper, Undergraduate Borrowing: A Study of Debtor Students and Their Ability to Retire Undergraduate Loans, which can be found here.  The data in this paper are from 2003-2004, so they predate the current economic dislocation, but the principles, I think, are intact.  The paper has a lot of good information in it; RTWT.

Using a student loan calculator, we can see some expected first year salaries and “affordable debt” suggestions for a number of majors.  I’ve selected four to be used illustratively throughout this post, and I used the calculator’s default values otherwise.

Major

Starting Salary

Maximum Manageable Debt Load

Sociology

$35,300

$35,976

Education

$35,900

$36,587

Engineering

$56,600

$57,683

Mathematics

$50,000

$50,957

These outcomes hold generally: the maximum manageable debt load is roughly the first year’s salary.  More than that is “excessive borrowing;” although this is a squishy limit.  Harrast defined excessive borrowing as “the difference between debt at graduation and lender-recommended debt level,” where the latter is based on an ability to pay 8% of a graduate’s second-year salary.  Others consider excessive debt to be total debt (which would include credit card, mortgage, if any, and the like, in addition to student loan debt) greater than 37% of income, which would lead most lending institutions to decline to lend.  All three definitions lead to substantially the same amount of “excess” for the purposes of this post.

Also, it’s clear that STEM-type majors (Science, Technology, Engineering, Mathematics) pay more, and so can borrow more, than do non-STEM majors.

Who incurs excessive student debt?  According to Mark Kantrowitz, of FinAid.org, that breakout looks like this for our example majors.

Major

Per Cent Overborrowing

Sociology

5.7%

Education

4.3%

Engineering

3.5%

Mathematics

3.6%

STEM students do better at managing their greater debts.  And importantly so: the overall average per cent of students excessively borrowing, across all majors, was 4.1%.

It’s also useful to lower the bar a bit and look at the size of excessive debt, given that it exists.  One way of looking at this is to look at the 75th percentile borrowing.

Major

Student Loan Debt at Graduation

Excess Student Loan Debt at Graduation

Sociology

$30,888

$11,795

Education*

$26,944

$7,850

Engineering**

$22,239

$3,146

Mathematics***

N/A

N/A

*Here, an average of Consumer Science and Education and Special Education
**Here, an average of Electrical and Mechanical Engineering
***Data were not provided by Harrast.

Plainly, some jobs are more valuable than others.  More importantly, the rigor associated with learning those jobs seems to correlate well with the ability of students to manage their debt buildup, and of the newly graduated to manage their accrued debt.

As some have asked,

Want to major in gender studies, women’s contemporary literary issues, or African-American history? Feel free, but don’t expect a dime from the US taxpayer. Because you likely won’t be able to pay your debt, and you most likely won’t be able to find a job to support yourself. Which means the degree is essentially worthless. And that is a luxury this country cannot afford any longer.

Jobs

The March Jobs report said there were 120,000 nonfarm jobs added in March, compared to economists’ expectations of 200,000 jobs and some 267,000, 275,000, and 240,000 added in December, January, and February, respectively.  The report also said that the population of folks actively looking for work—the denominator in the headline unemployment rate—shrank by 161,000 to 63.8% American adults as yet more people gave up on our suppressed economy and stopped looking for work.  This participation rate has fallen steadily for the last three years, from its nearby high of 65.8% in January 2009.

The long-term unemployed (jobless for 27 weeks and over) remained at 42.5% of the total unemployed.

Meanwhile, initial jobless claims increased by 13,000 to a seasonally adjusted 380,000 in the week ended April 7.  This also is the largest jump in a year.

Keep in mind that one month does not make a trend.

But.  Our economic recovery is in full bloom, all right.

Another Government Mandate

Last December, the Director of the Labor Department’s Office of Federal Contract Compliance Programs, Patricia Shiu, proposed, in all seriousness, a regulation requiring companies, apparently with 50 or more employees, to adopt a 7% hiring quota for disabled job applicants or be debarred from doing business with the federal government.  Note that this isn’t 7% of the total number of employees—Ms Shiu is a better micromanager than that.  This is a quota of 7% in each separate job category: “one or more jobs with similar content, wages rates, and opportunities.”

Moreover, Shiu’s rule attempts to require companies to encourage all job applicants to label themselves as “disabled” prior to being hired—apparently without any screening of applications or applicants for accuracy of the claim—and to require companies to engage in an ongoing compliance regime: companies must encourage all employees “to label themselves disabled after being hired, and once a year thereafter,” again apparently without any regard for the accuracy of such self-labeling.  Additionally, the rule would require each company to document, in detail, for each applicant not hired, why that applicant was not hired.  I wonder whether “Because I already hired someone for the position” would be acceptable.  On top of this, each company would be required annually to (re)justify and to  (re)document “the physical and mental job qualifications for [every] job opening…and to provide an explanation as to why each requirement is related to the job to which it corresponds” and to prove each requirement to be “consistent with business necessity.”

Labor’s estimate of the cost of compliance is cynically understated by two orders of magnitude: they claim a cost of just $81 million for roughly 200,000 companies to comply—a cynical $400 per company.  HR Policy estimates the true cost (not counting productivity costs, which are much harder to estimate) to be in the region of $1.8 billion—a more realistic $9,000 per company.  Of course, not included in Labor’s estimate is the cost of hiring all those bureaucrats into Ms Shiu’s burgeoning empire to monitor compliance.  Nor is the cost of all the lawyers companies will have to retain to defend themselves against all the litigation such a rule is going to encourage.

What constitutes an eligible disability?  Reading, concentrating, thinking, communicating, and interaction with others all are on the list.  I have to wonder at the productivity costs of having to have folks on the payroll specifically to read instructions to employees who can’t read; to do so repeatedly to employees that can’t concentrate long enough to absorb the instructions; to monitor employees who can’t concentrate long enough to complete the job assigned; to guide employees who can’t think clearly enough to understand the instructions they’ve just read or had read to them, or to figure out a task when no monitor is readily available; who can’t explain the trouble they’re having to their peers or supervisors; or who don’t get along with their peers or supervisors.

Oh, and hypocrisy notice: the Federal government itself has only 5% disabled on its payrolls—and the Labor Department’s percentage of disabled employees has decreased every year since President Obama took office, despite Obama’s sharp increase in Labor hiring.

There went the “opportunities.”  Why would a company hire at all in such an environment?  Sounds like a good reason to decline to do business with the Federal government.

Recovery, and Recovery, and Recovery

…creeps in this petty pace.*  Here are some statistics, courtesy of Edward Lazear, writing for The Wall Street Journal.

  • In the three years [after the Great Depression of 1930-33], the economy rebounded with growth rates of 11%, 9%, and 13%, respectively.
  • The current recovery, beginning in 2009, has had growth rates of in 3% and 1.7% in 2010 and 2011, respectively.  The [2012] growth rate looks to be about 2%.
  • From post-WWII to the current recession (1947-2007), the US’ average annual growth rate was 3.4%.
  • Since the ’80s, we’ve had somewhat slower growth, but even here, the average growth rate was 3%.
  • During our current “recovery,” our economy has grown at 2.4%—below both that long-term trend, and the intermediate, nearby trend.
  • Today our economy is 12% smaller than it would have been had we matched our growth trend since 2007.
  • Today our economy is 4 per centage points further off trend line than it was 1Q09 when President Obama’s nearly trillion-dollar “stimulus” effort started.

Historically, the deeper the recession, the stronger the subsequent recovery.  The present “recovery” isn’t robust by any measure.  It’s not even catching up.

Whose policies have been in effect throughout this creeping, petty “recovery?”  Not those of Bush the Younger.

*With apologies to the Thane, Macbeth.