President Obama is campaigning heavily, these days, on the strength of “his” economic recovery. Let’s look at this recovery.
Peter Ferrera, cited in The Wall Street Journal, writes
From 1947 to 2007, the U.S. economy averaged real growth of 3.2% a year. At that rate, our GDP would double every 22 years. … Last year, U.S. real economic growth was a paltry 1.7%. The current quarter will probably not be much better.
and
[T]he American economy catching up to its long term economic growth trend line would mean the economy booming over the next 10 years with average annual real growth of 4.4%, and then continuing on after that at 3.2% real annual growth. Ten years of 4.4% real growth would leave the American standard of living, and GDP, over 50% higher than today. That is the boom this economy has in it naturally, with the right pro-growth policies just getting the government out of the way, and freeing the economy to grow.
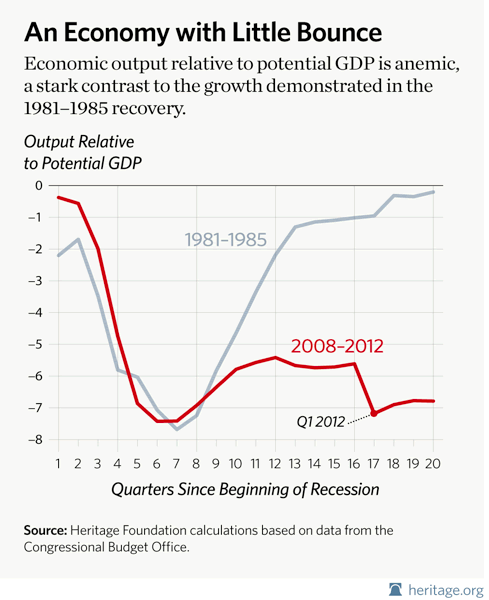
How are Obama’s policies doing? Typical recession recoveries are faster and higher the deeper the recession from which we’re recovering. This chart draws a comparison with our nearby history—the recovery from the recession of the ’80s, which was as deep and hard as the present one.  The recovery just isn’t there very much. Unemployment is falling off, and job creation is occurring (more on that below), but it’s anemic. The zero-line represents full GDP output—our economy is operating on all cylinders—and three years after the ’80s recession’s deepest point, we were at full production. With the current recession, it’s not even close. In fact our current growth rate of 2.4% per year since the recession’s formal end in the spring of 2009 is the slowest rate since WWII.
The next three charts look at our labor—our employment—picture in particular. 
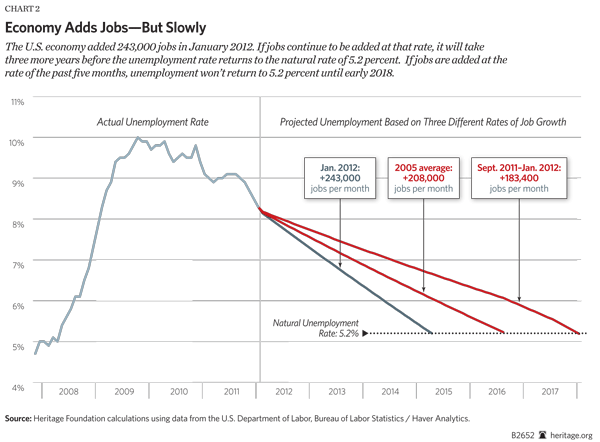
This chart looks at three different growth rates and the time from today to full employment. If employers continue to add jobs at the same rate they did between September 2011, when unemployment began to improve, and last January—183,400 jobs per month—the unemployment rate won’t reach even 7.8% for another 20 months, December 2013, and will not full employment for five more years: January 2018. Even if employers add jobs at their 2005 pace, we won’t reach full employment until mid-2016, and if January’s unusual rate is continued, we’re still looking at mid-2015 before reaching full employment.
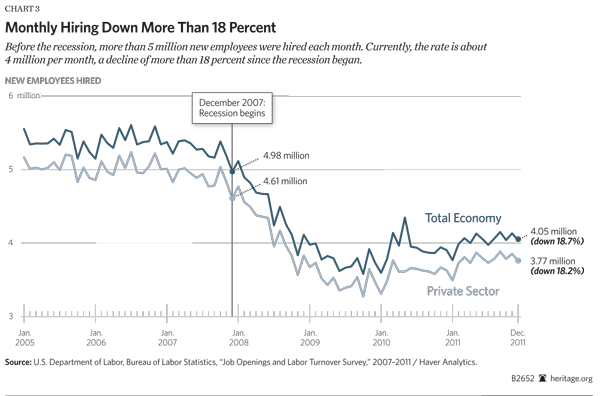
This next chart gives another look at our future. 
Fewer existing businesses are hiring, and fewer entrepreneurs are starting new businesses; there are fewer jobs for the unemployed. Moreover, it takes time for startups to grow and to increase their hiring, just as it does existing businesses to recover, resume growing, and increase their own hiring. Delays now in growth and job creation mean continued delays tomorrow in getting growth going and hiring to increase.
The next chart shows the falling labor participation rate in our current economy. 
The present 63.7% of adult Americans active in the labor force (either employed or looking for work) is the lowest participation rate since 1983—when far fewer women were working. Keep in mind that this historically low participation rate artificially reduces the measured—headline—unemployment rate because folks not looking for work aren’t counted as unemployed. The Congressional Budget Office estimates that the unemployment rate would be 1.25 points higher—9.45%—if labor force participation were at normal levels.
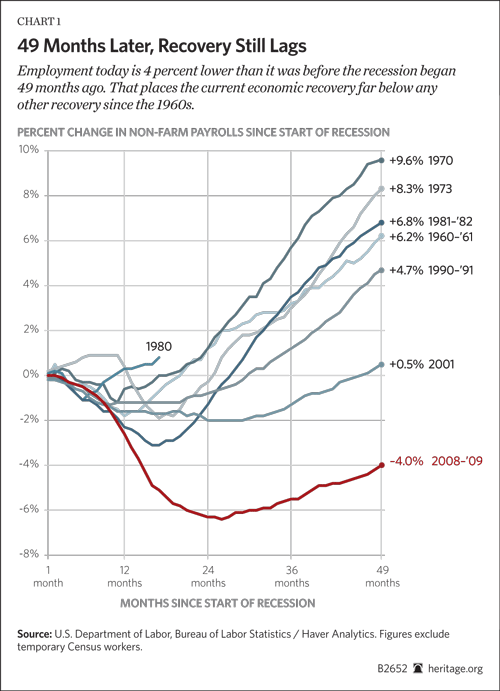
Finally, how does our current recession…recovery…compare with past recoveries? This last chart is illustrative. 
In every prior post-war recession, employment has fully recovered within four years. As of December 2011—four years after the recession’s onset—payroll employment remains 4.0 percent below the number of workers employed when the recession started in December 2007. Private-sector employment is 4.5 percent below pre-recession levels. That represents 5.6 million net fewer jobs; 5.2 million of those net job losses occurred in the private sector.
In sum, as The Heritage Foundation points out,
It’s the natural tendency for the economy to grow—and taking credit for its meager improvement is sort of like accepting kudos for the rising and setting of the sun.
We have any sort of recovery at all solely because of that natural tendency to grow. What are the differences between our current straits and past recession recoveries? Obama’s policies are of a kind with a prior Progressive President, Franklin Roosevelt. Both sets of policies centered on expansive, intrusive government, increasingly interfering with the operation of our free market and even going so far as to dictate what individual Americans are permitted—or required—to do in the market place. All for our own good. Just as those policies so tragically prolonged the Depression of the ’30s, so are these policies prolonging the current recession’s effects.
On the other hand, when met with shrinking government and reducing personal and business tax rates, as Jack Kennedy (!) and Ronald Reagan, for instance, did, our free market economy responded with rapid, prolonged growth.
I agree with President Obama. The credit for these three years of historically poor economic performance is entirely his.
