Two Tax Plans

On the one hand, we have the House Republicans’ proposed tax plan, one whose construction was led by the House Budget Committee Chairman, Congressman Paul Ryan (R, WI).  The outline of this plan contains replacement of our present six income tax brackets with just two, 10% and 25%, and reduction or elimination of tax loopholes used by (the nebulously defined) “high-income” Americans.  Ryan suggested

Take away the tax shelter, subject all of their income to taxation, and get more revenue—and we can lower everybody’s tax rate in return.

Beyond that, Ryan conceded that at this early stage, it’s not possible to know whether these “wealthy” would gain or lose from the exchange, and he refused to go into detail on the loopholes to be cut or eliminated.  It’s the House Ways and Means Committee’s task to work out the tax details in any budget proposal; until the details are worked out, the impact of the changes is inherently unknowable; and Ways and Means discussions should be held by that committee in public, not by Ryan on talk television programs, including Fox News Sunday, where these remarks were recorded.

President Obama didn’t waste time objecting to the plan.  Through his senior advisor, David Plouffe, he told Fox News Sunday that Ryan’s plan “fails the test of balance, fairness and shared responsibility.”  This certainly does draw a stark contrast between the Republicans’ ideas and his own: he continues to demand his right to raise taxes, with the inherent unfairness of taking money that doesn’t belong to government in the first place, or of raising taxes to get money the government doesn’t need.  Obama went on, claiming the Ryan plan would give the “average millionaire and billionaire” a tax cut of $150,000:

It showers huge tax cuts on millionaires and billionaires, paid for by seniors and veterans.

Here is demonstrated Obama’s breathtaking omnipotence: it’s not possible to know the effect since the Ways and Means Committee has not written the details, but he “knows,” anyway.

Obama then disparaged the Ryan plan’s vouchers for Medicare while continuing to refuse to offer any evidence of the downside of such vouchers—continuing, instead, his drumbeat of cynically unsubstantiated claims of rising costs to seniors.  With these aspersions, he also ignores the market competition effects on costs from seniors shopping their business around among private health insurers.  Moreover, his complaint comes with his continued refusal to offer a solution of his own.  He insists, instead, on simply defunding Medicare through his Patient Protection and Affordable Care Act and his payroll tax cut, despite the pending financial failure of the current Medicare system.

On the other hand, the Table below shows Democratic Party’s tax plan for our consideration and discussion:

Oh, wait: they don’t have one.  They’ve refused these last three years even to offer one beyond the cynical jokes contained in Obama’s “budget” proposals.  They’ve just had the courage of sitting on the sidelines sniping at plans that others have offered—and then refusing even to discuss those other plans in the Senate.
Green Energy and Financing

The Copper Mountain power plant, a solar (photovoltaic) power plant in Boulder City, NV, produces enough electricity to power 17,000 homes.

This isn’t a typical “green” energy project, though.  This is a true green energy one: aside from $60 million in federal and state tax incentives, the project, including the 450 acres of land obtained to house the collectors, was entirely privately financed.  The tax incentives I consider a wash, because those are typical offerings from any jurisdiction in order to induce companies of any industry to locate their business here, rather than there.

Scott Crider, spokesman for Copper Mountain’s parent Sempra US Gas & Power, points out that the solar plant is a winner for taxpayers, estimating that the plant will generate $2 for the governments involved for every $1 in tax incentives over the next 30 years.

Copper Mountain and Sempra demonstrate that serious projects need no government largess.  Moreover, that payoff ratio gets even better when projects are wholly privately financed.

House 2013 Budget Blueprint

This is, indeed, a contrast in visions.  We are in the middle of a struggle for the future of our country, and the budget blueprint lays out the parameters of that struggle.

This table, from the House’s Committee on the Budget’s Web site, lays out the contrast pretty clearly.


The President’s Budget

House Blueprint

pending

Net $1.5 trillion increase relative to current policy Cuts spending by $5 trillion relative to President’s budget

Taxes

Imposes a $1.9 trillion tax increase; Adds new complexity and new hurdles for hardworking taxpayers, making it more difficult to expand opportunity Prevents President’s tax increases; Reforms broken tax code to make it simple, fair, and competitive; clears out special interest loopholes and lowers everybody’s tax rates to promote growth

Deficits

Four straight trillion-dollar deficits; Breaks promise to cut deficit in half by end of first term; Budget never balances Brings deficits below 3 percent of GDP by 2015; Reduces deficits by over $3 trillion relative to President’s budget; Puts budget on path to balance

Debt

Adds $11 trillion to the debt – increasing debt as a share of the economy – over the next decade; Imposes $200,000 debt burden per household; Debt skyrockets in the years ahead Reduces debt as a share of the economy over the next decade; Charts a sustainable trajectory by reforming the drivers of the debt; Pays off the debt over time

Size of Government

Size of government never falls below 23 percent of the economy, making it more difficult to expand opportunity Brings size of government to 20 percent of economy by 2015, allowing the private sector to grow and create jobs

National Security

Slashes defense spending by nearly $500 billion; Threatens additional cuts by refusing to specify plan of action to address the sequester; Forces troops and military families to pay the price for Washington’s refusal to address drivers of debt Prioritizes national security by preventing deep, indiscriminate cuts to defense; Identifies strategy-driven savings, while funding defense at levels that keep America safe by providing $554 billion for the next fiscal year for national defense spending

Health Security

Doubles down on health care law, allowing government bureaucrats to interfere with patient care; Empowers an unaccountable board of 15 unelected bureaucrats to cut Medicare in ways that result in restricted access and denied care for current seniors, and a bankrupt future for the next generation Repeals President’s health care law; Advances bipartisan solutions that take power away from government bureaucrats and put patients in control; No disruption for those in or near retirement; Ensures a strengthened Medicare program for future generations, with less support given to the wealthy and more assistance for the poor and the sick

A couple of comments are in order (I’ll ignore the political hype in the characterizations in both sides of this table and address only the actual data provided).

First, notice that President Obama’s budget (about which neither he nor his Senate Democrat minions are serious; this is just a campaign speech) both increases Federal spending an enormous amount and increases taxes even more.  This certainly is one way to balance the budget (IFF the tax revenues resulting from those increases actually occur; however, raising taxes actually lowers tax revenue flowing by reducing the economic activity that produces those revenues), but it does so at the expense of our economy’s ability to function.  It constitutes $3.4 trillion dollars taken away from individual Americans and our businesses, either directly—those taxes—or indirectly by taking our spending decisions away from us and putting them into the hands of the Federal government.  It says that we Americans are utterly incapable of making our own money allocation decisions; we must yield those to our Betters in government.

The House budget blueprint, though (it’s certainly true that it could serve as a campaign speech, but it has the added—and critical—advantage of being an actual, workable budget blueprint), recognizes two fundamental things: the money involved is ours, not government’s; we only allocate some of our money to government to spend on our purposes (and not on government’s purposes).  Secondly, the government does not need the money, it does not need those taxes; government does need to spend less.  Period.  It really is that simple.

My second comment concerns the two plans’ attitude toward the appropriate size of government and from that their attitudes toward us Americans.  Obama wants to expand government, not only in size but in authority over our lives.  Government is the answer to our problems, and so the Progressives seek to increase our dependency on government.  Moreover this increase in dependency is not limited to those of us who already are government dependents.  Progressives want to make us all government wards.  We cannot be trusted to work out our own solutions, to make our own decisions.  We’re just not good enough at it.

The House blueprint, in stark contrast, shrinks the size and power of government.  This blueprint respects and trusts us Americans to make our own decisions, and to do a better job for each of us individually, as well as for any groups of us, than government can ever hope to do.  After all, at best, government is limited either to a one-size-fits-all solution (which perforce actually fits no one) or to a collection of “solutions” tailored to groups of us (groupings defined by government, mind you, not by us) that demands an army of bureaucrats to administer and another army of lawyers to interpret and defend.

The choice, then, is clear: whom should we elect this fall?  A collection of politicians who don’t trust us with our own lives, or a collection of politicians who are looking actually to reduce government’s—and their—power over us?

JOBS

Who wants any of these?  Plainly not Progressives and their supporters.

The House of Representatives passed the Jumpstart Our Business Startups Act on 8 March by a vote of 390-23 (yes, that’s 158 Democrats in the House that also voted for this bill.  Apparently not all Progressives are anti-JOB).

But now that it’s in the Democratic Party-controlled Senate, where is it?  Senate Majority Leader Harry Reid refused to allow it to be debated and voted on unless he got his approved judges voted up in his “jobs for judges” debacle.

Others, Progressives and turf-protecting bureaucrats and unions, also have weighed in in opposition.

SEC Chairman Mary Shapiro, whose regulatory empire would be reduced, however slightly, objects to a provision to exempt companies with annual revenues less than $1 billion from a variety of regulations like Dodd-Frank’s executive compensation rules and duplicative Sarbanes-Oxley audits of internal controls.  Senate Majority Whip Dick Durbin joined this particular fray arguing that the agency that watched, while doing nothing, Allen Stanford and Bernie Madoff is somehow needed to oversee the next Bill Gates or Steve Jobs or Mark Zuckerberg.

The accounting firms that stood around and watched Enron and WorldCom are objecting to a reduction in the mandate (i.e., guaranteed business and fees) for their “services”  stemming from an exemption for new companies from critical parts of SOX.

Unions, worried about their own loss of power in a free market environment, object because—well, just because.

Senate Progressives (other than Reid) object because it came from a Republican House.

The Senate vote will be interesting to watch.

An Economy

President Obama is campaigning heavily, these days, on the strength of “his” economic recovery.  Let’s look at this recovery.

Peter Ferrera, cited in The Wall Street Journal, writes

From 1947 to 2007, the U.S. economy averaged real growth of 3.2% a year. At that rate, our GDP would double every 22 years. … Last year, U.S. real economic growth was a paltry 1.7%. The current quarter will probably not be much better.

and

[T]he American economy catching up to its long term economic growth trend line would mean the economy booming over the next 10 years with average annual real growth of 4.4%, and then continuing on after that at 3.2% real annual growth.  Ten years of 4.4% real growth would leave the American standard of living, and GDP, over 50% higher than today.  That is the boom this economy has in it naturally, with the right pro-growth policies just getting the government out of the way, and freeing the economy to grow.

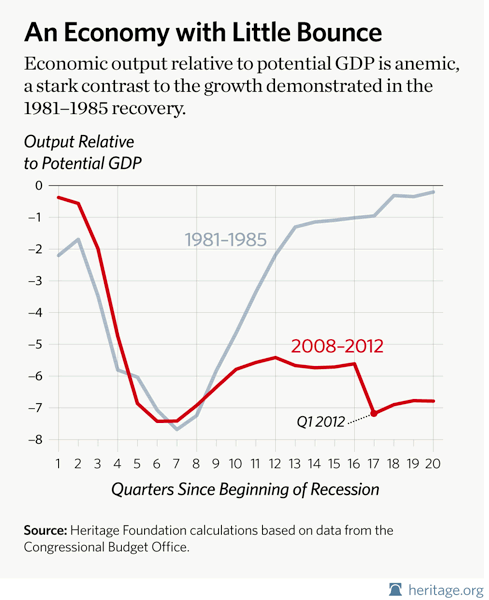
How are Obama’s policies doing?  Typical recession recoveries are faster and higher the deeper the recession from which we’re recovering.  This chart draws a comparison with our nearby history—the recovery from the recession of the ’80s, which was as deep and hard as the present one. The recovery just isn’t there very much.  Unemployment is falling off, and job creation is occurring (more on that below), but it’s anemic.  The zero-line represents full GDP output—our economy is operating on all cylinders—and three years after the ’80s recession’s deepest point, we were at full production.  With the current recession, it’s not even close.  In fact our current growth rate of 2.4% per year since the recession’s formal end in the spring of 2009 is the slowest rate since WWII.

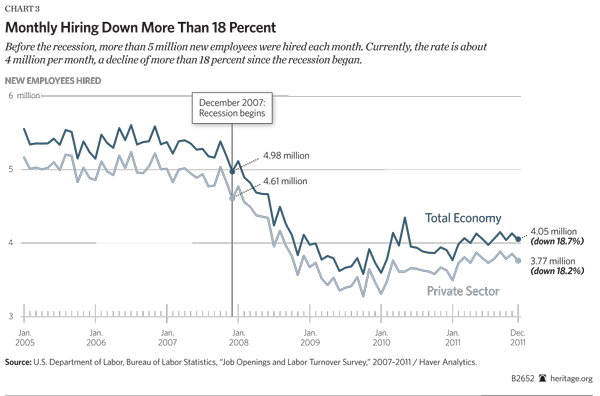
The next three charts look at our labor—our employment—picture in particular.

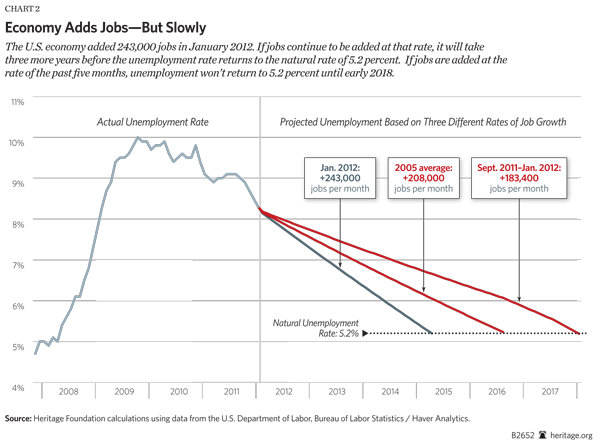
This chart looks at three different growth rates and the time from today to full employment.  If employers continue to add jobs at the same rate they did between September 2011, when unemployment began to improve, and last January—183,400 jobs per month—the unemployment rate won’t reach even 7.8% for another 20 months, December 2013, and will not full employment for five more years: January 2018.  Even if employers add jobs at their 2005 pace, we won’t reach full employment until mid-2016, and if January’s unusual rate is continued, we’re still looking at mid-2015 before reaching full employment.

This next chart gives another look at our future.

Fewer existing businesses are hiring, and fewer entrepreneurs are starting new businesses; there are fewer jobs for the unemployed.  Moreover, it takes time for startups to grow and to increase their hiring, just as it does existing businesses to recover, resume growing, and increase their own hiring.  Delays now in growth and job creation mean continued delays tomorrow in getting growth going and hiring to increase.

The next chart shows the falling labor participation rate in our current economy.

The present  63.7% of adult Americans active in the labor force (either employed or looking for work) is the lowest participation rate since 1983—when far fewer women were working.  Keep in mind that this historically low participation rate artificially reduces the measured—headline—unemployment rate because folks not looking for work aren’t counted as unemployed.  The Congressional Budget Office estimates that the unemployment rate would be 1.25 points higher—9.45%—if labor force participation were at normal levels.

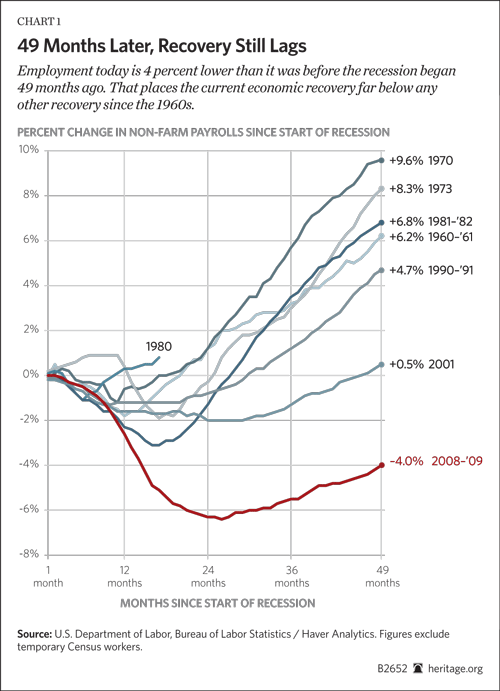
Finally, how does our current recession…recovery…compare with past recoveries?  This last chart is illustrative.

In every prior post-war recession, employment has fully recovered within four years.  As of December 2011—four years after the recession’s onset—payroll employment remains 4.0 percent below the number of workers employed when the recession started in December 2007. Private-sector employment is 4.5 percent below pre-recession levels.  That represents 5.6 million net fewer jobs; 5.2 million of those net job losses occurred in the private sector.

In sum, as The Heritage Foundation points out,

It’s the natural tendency for the economy to grow—and taking credit for its meager improvement is sort of like accepting kudos for the rising and setting of the sun.

We have any sort of recovery at all solely because of that natural tendency to grow.  What are the differences between our current straits and past recession recoveries?  Obama’s policies are of a kind with a prior Progressive President, Franklin Roosevelt.  Both sets of policies centered on expansive, intrusive government, increasingly interfering with the operation of our free market and even going so far as to dictate what individual Americans are permitted—or required—to do in the market place.  All for our own good.  Just as those policies so tragically prolonged the Depression of the ’30s, so are these policies prolonging the current recession’s effects.

On the other hand, when met with shrinking government and reducing personal and business tax rates, as Jack Kennedy (!) and Ronald Reagan, for instance, did, our free market economy responded with rapid, prolonged growth.

I agree with President Obama.  The credit for these three years of historically poor economic performance is entirely his.