
Much is made of the market drop last spring pursuant to the government’s decision to close down our economy in response to the apparent (apparent because we were operating on vastly incomplete data, much of which was being deliberately falsified by the People’s Republic of China). Much is made, too, of the market recovery later in the spring as our economy was permitted by government to begin reopening.
Readers of this blog know that I view the market as economically strongly tied to the underlying economy, but only loosely tied to it temporarily.
This graph, via MarketWatch, puts last spring’s market drop and recovery, illustrated by the S&P 500 Index, into some context.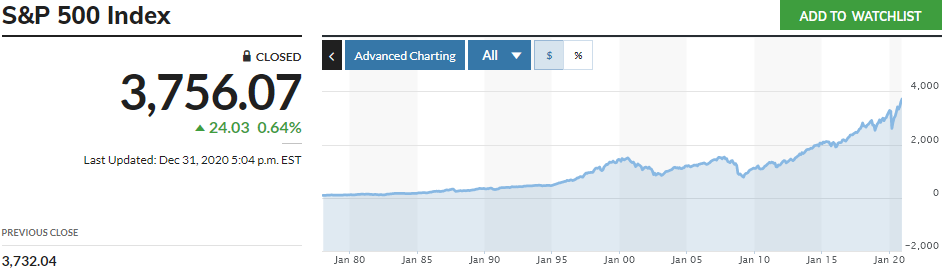
The axes are somewhat hard to read (right click on the image and select View Image from the pulldown to get a larger image), but the X-axis labels run from Jan 80 through Jan 20. The data themselves actually run from 1 Jan 78 through 1 Nov 2020.
Last spring’s government-caused Wuhan Virus drop and recovery (the grey-blue region at the right end) compares in two ways with previous drops. This government-caused drop is no deeper than the two economically-driven drops of the last 32 years: the dot-com bust of Jun 00 to Dec 02 and the Panic of 2008 of Jun 08 to Mar 09. The Wuhan Virus drop and recovery also was much steeper and the recovery must faster than those prior drops: 6 months vs 18 months and 10 months just for the drops, and an additional 4 years to recover from dot-com and from the Panic.
Beyond that, the current Wuhan Virus data suggest that the government-mandated shutdown had very little impact on the virus’ progression. Especially given that key government officials like Anthony Fauci, National Institute of Allergy and Infectious Diseases Director, openly lied about the severity of the virus and what we should do about it.