
Here’s an interesting graph, produced by Oren Cass in American Affairs: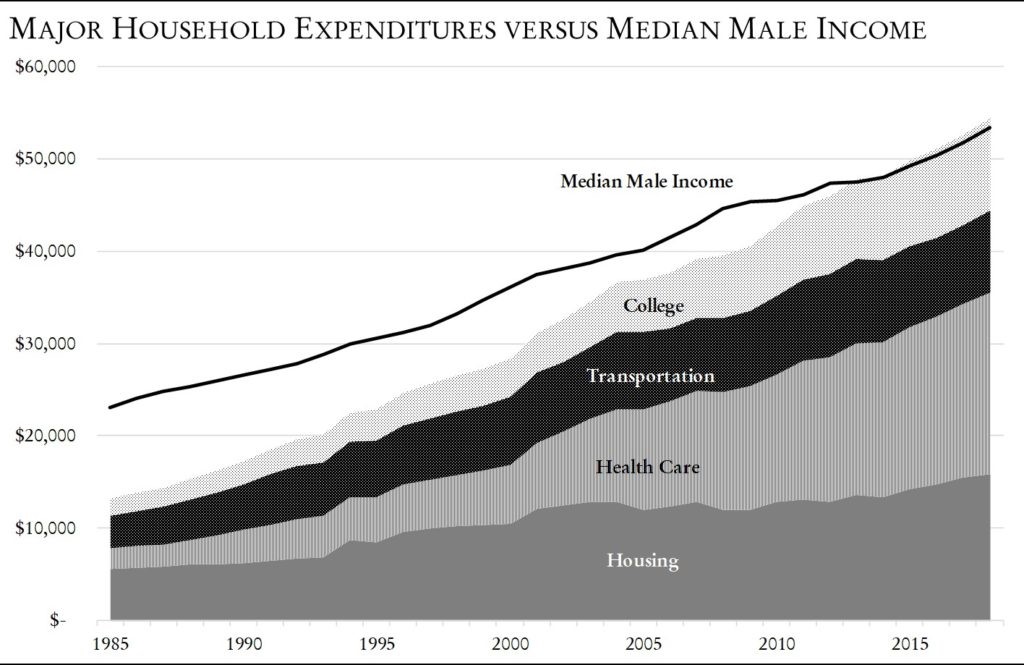
These are current dollars relative to current wages. Thus, the $13k total cost in 1985 was covered by a then-average $440 weekly wage, and the $54k total cost in 2018 was covered by that year’s $1,000 weekly wage.
Here are the underlying cost and wage data:
Notice which two costs ran up the hardest. Here’s a hint: health care exploded by a factor of 8; even college rose only by a factor of roughly 5; the others increased less than 3 times.
H/t Conrad Hackett, who has a colorized version of the graph.