
The Dow Jones 30 Industrials dropped nearly 1200 points on Monday, a numerically large drop. But what does it mean, really? We’ve had a steady, and over the last few months steadily steep, rise in the Dow. The simple fact is, investors are taking profits off the table. The proximate cause—the excuse—is fear of inflation triggered (if I can use that term) by good employment numbers and rising wages (finally). The underlying economy is sound, the tax bill just passed is making our economy more so. To put things in perspective, here are two graphs of the Dow consisting of daily data since 1 January 1980 through 2 February 2018. The data are unadjusted, meaning they are just the daily close, without dividends figured in.
This graph is of the raw data through the 5th. Notice that Monday almost doesn’t show up in the grand scheme of things.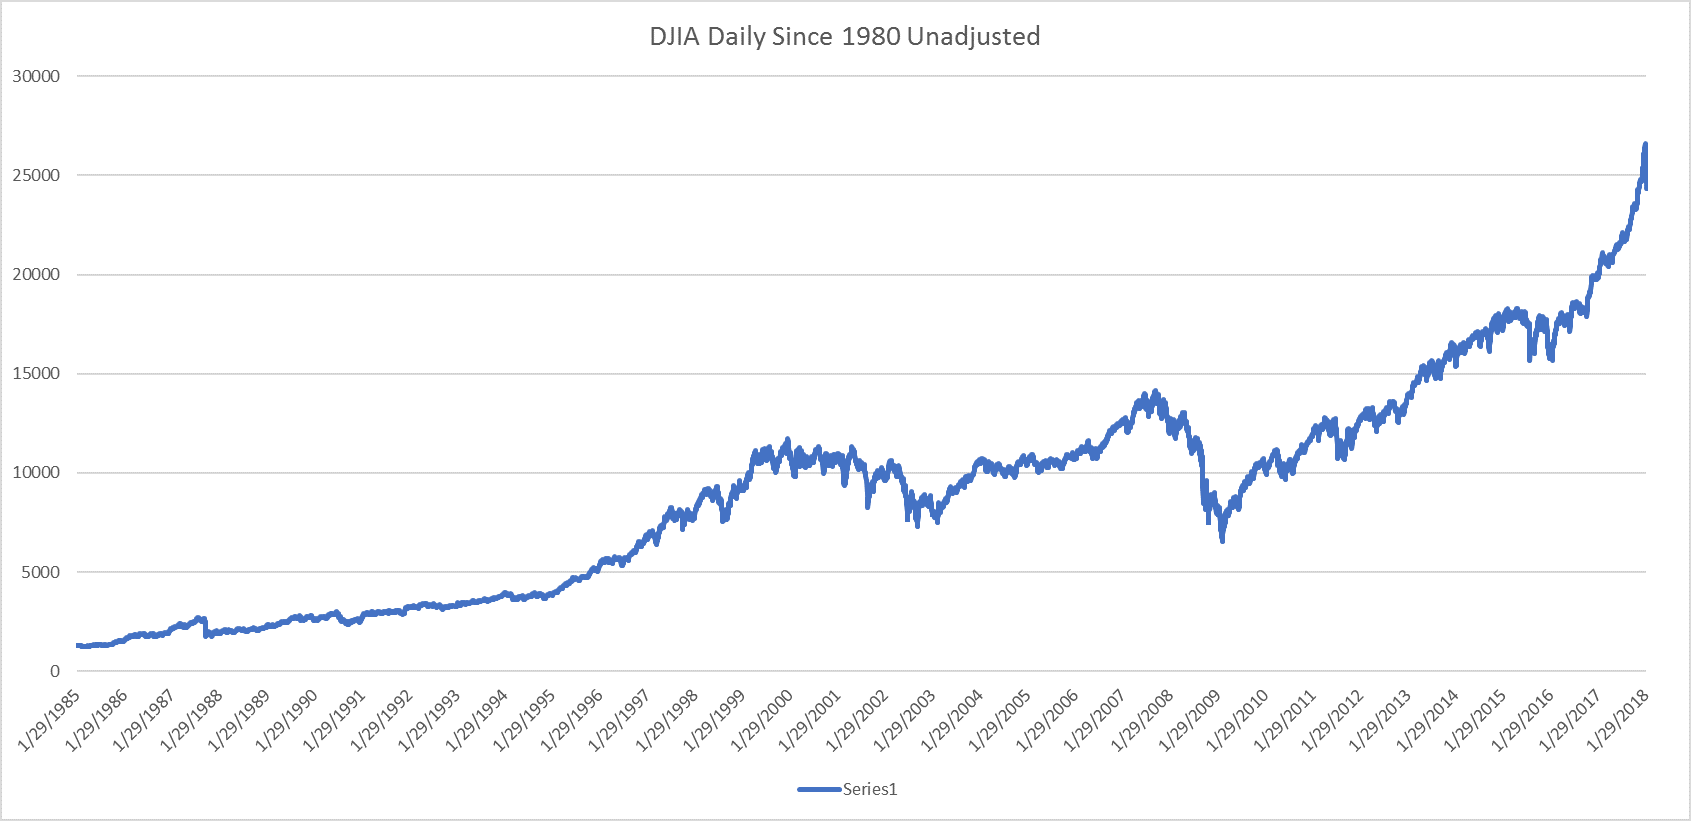
This graph uses the same data and puts them onto a log10 scale, which has the advantage of smoothing out exponential growths. Over the last 37 years, none of the big drops—or rises—show up very well. The Panic of 2008 only barely appears, and the dot-com bust is just a small dip. The Dow has been rising steadily, with the short-term burbles put into perspective.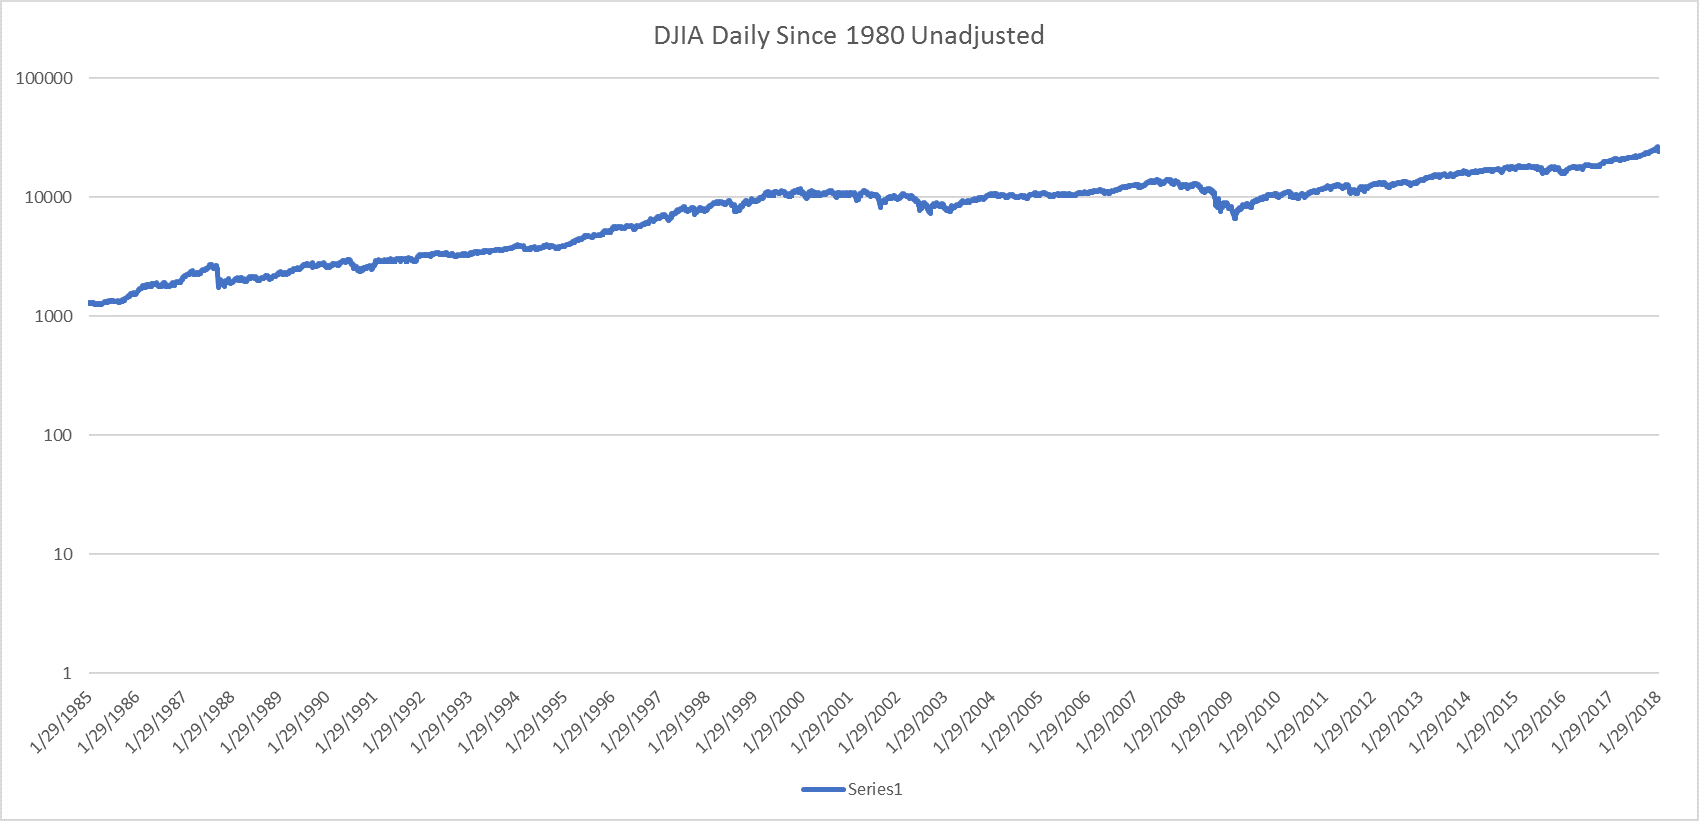
This is a buying opportunity claims this layman investor.