
Some empirical data are starting to accumulate. The following graphs are from AEIdeas. The first one shows the apparent impact of Seattle’s minimum wage law, which hiked the minimum to $15/hr, with the first increment to $11/hr taking effect last April. The graph shows restaurant employment in the Seattle Metropolitan Statistical Area and Washington other than the Seattle MSA from 2010 through Sept 2015.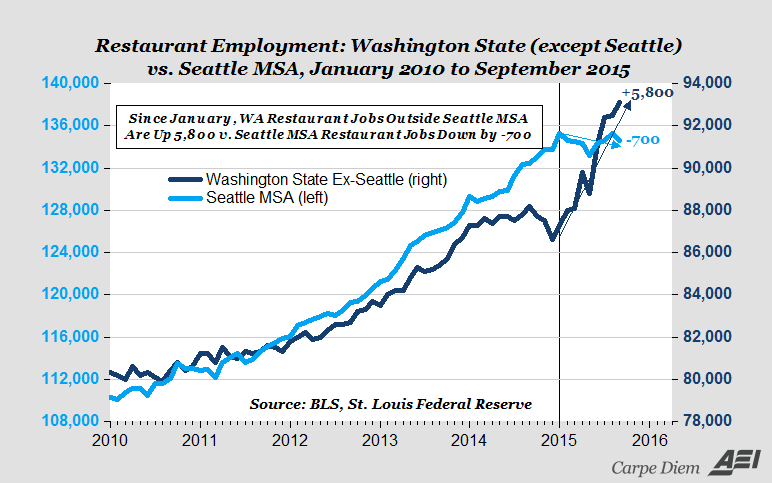
There are a couple of things of interest here. One is the headline comparison: Restaurant jobs went up nearly 6% since January (5,800 jobs added to an original value of 87,000 jobs), while the city’s restaurant employment fell those 700 jobs (a drop a skosh under 1%). The other is the trend. Since January, restaurant jobs have risen at a high month-month rate, while Seattle’s restaurant job growth rate has been flat.
There’s another tale in this graph.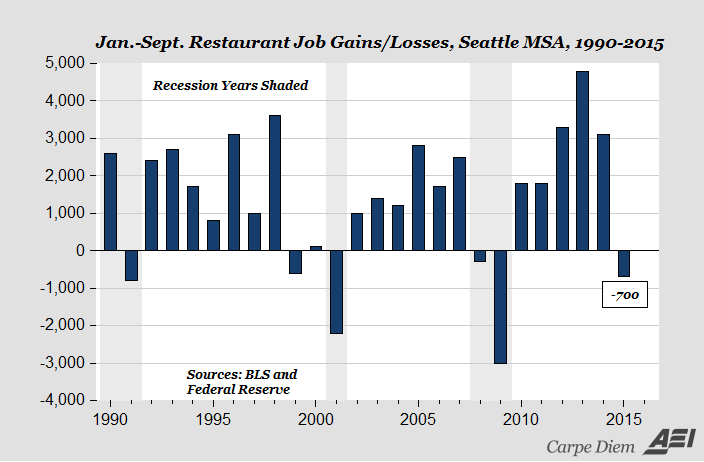
The shaded area are recessions. Only one other time since 1990 has Seattle’s restaurant employment fallen outside of a recession. That was in the year leading into the dot-com bust, with Seattle being nearly as techy as California’s Silicon Valley.
Hmm….