
AEIdeas‘ James Pethokoukis has some data in his article, “Obama’s low-wage jobs recovery.” He talked about the type of jobs being…created…in this so-called recovery; the graph below highlights his point.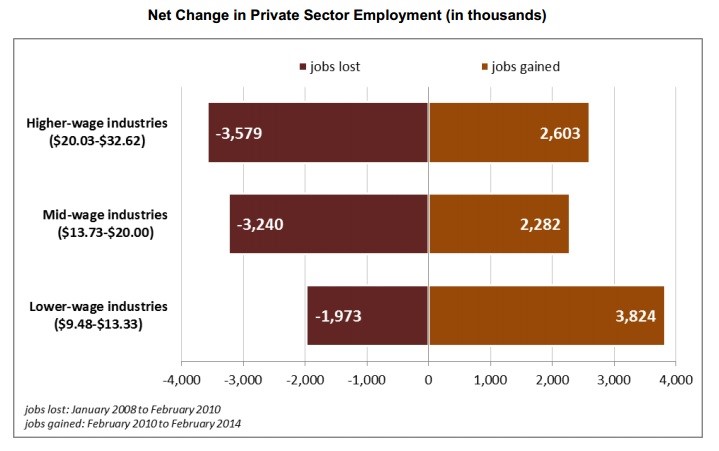
There’s another aspect to this, though, and that’s the income implication of the type of jobs being created. I constructed the table below from the data in the graph above, using the mid-points of each industry type wage range and assuming a 2080 hour work year—that is, everyone, even the low-wage industry worker, either works all 52 weeks of the year or gets paid in full for vacation time, including holidays, to keep the arithmetic simple.
| Wage Mid-Point | Jobs Lost (Thousands) | Jobs Gained (Thousands) | Not Jobs Gained (Thousands) | Net Annual Wages Gained/Lost (Thousands $) | |
| High Wage: | $26.3250 | (3,579) | 2,603 | (976) | ($53,441,856) |
| Medium Wage: | $16.8650 | (3,240) | 2,282 | (958) | ($33,605,874) |
| Low Wage: | $11.4050 | (1,973) | 3,824 | 1,851 | $43,910,162 |
| Total: | ($43,137,567) |
You’re reading that right. The only net gain in income is in the low end industries; these folks, by being able to go back to work, have gotten a net increase of some $44 billion in their annual income. But that’s swamped by the losses in the other two categories, and the nation as a whole has lost some $43 billion in annual income.
This is a fine recovery, yes, indeed.