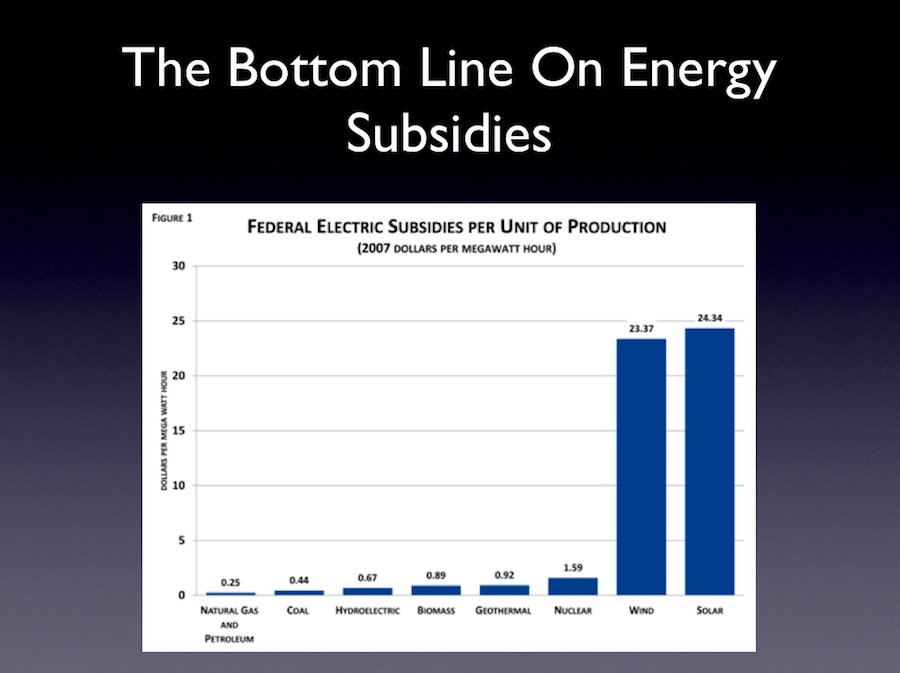
John Hinderaker has a couple of slides from a Power Line post of his from the middle of last month that are instructive. The first indicates the relative overt subsidy payments for a range of electric energy producer types.
 In case you’re having trouble reading it, the salient parts are these: the figure shows Federal electric subsidies in dollars per MW-hr produced (2007 dollars). The values on the left are for Natural Gas and Petroleum and for Coal at $0.25 and $0.44, respectively. The values on the right are for Wind and for Solar at $23.37 and $24.34, respectively. Those evil oil, natural gas, and coal companies get less than 2% of the subsidy Precious wind and solar companies get.
Pop quiz: which are the market-competitive companies?
There’s also this slide, which shows oil production rates over the last several years. Recall its backdrop: President Obama’s claim that, on his watch, oil and gas production are up sharply.
 The blue line indicates oil production on Federal land, and the Red line indicates production on private and State land. The key interval is from 2007 on, when the Progressives had control of the Congress, followed shortly by Progressive control of the Executive Branch. Notice that while production from private and State land was rising, production from Federal land was being driven down. This, coupled with Obama’s slow-walking of Gulf deep water drilling permits; his refusal to allow new drilling, much less production beyond existing wells, into/from known oil deposits on Federal land; his EPA’s CO2 regulation over even a Progressive Congress’ objection; his killing of the Keystone XL pipeline; and so on, represent a far more powerful, and far more insidious, subsidy of his Precious “green” energy producers: active suppression of competition from production of cheap hydrocarbon-based energy from nearby sources.
Some subsidies are more equal than others.
